Dashboards and Insights
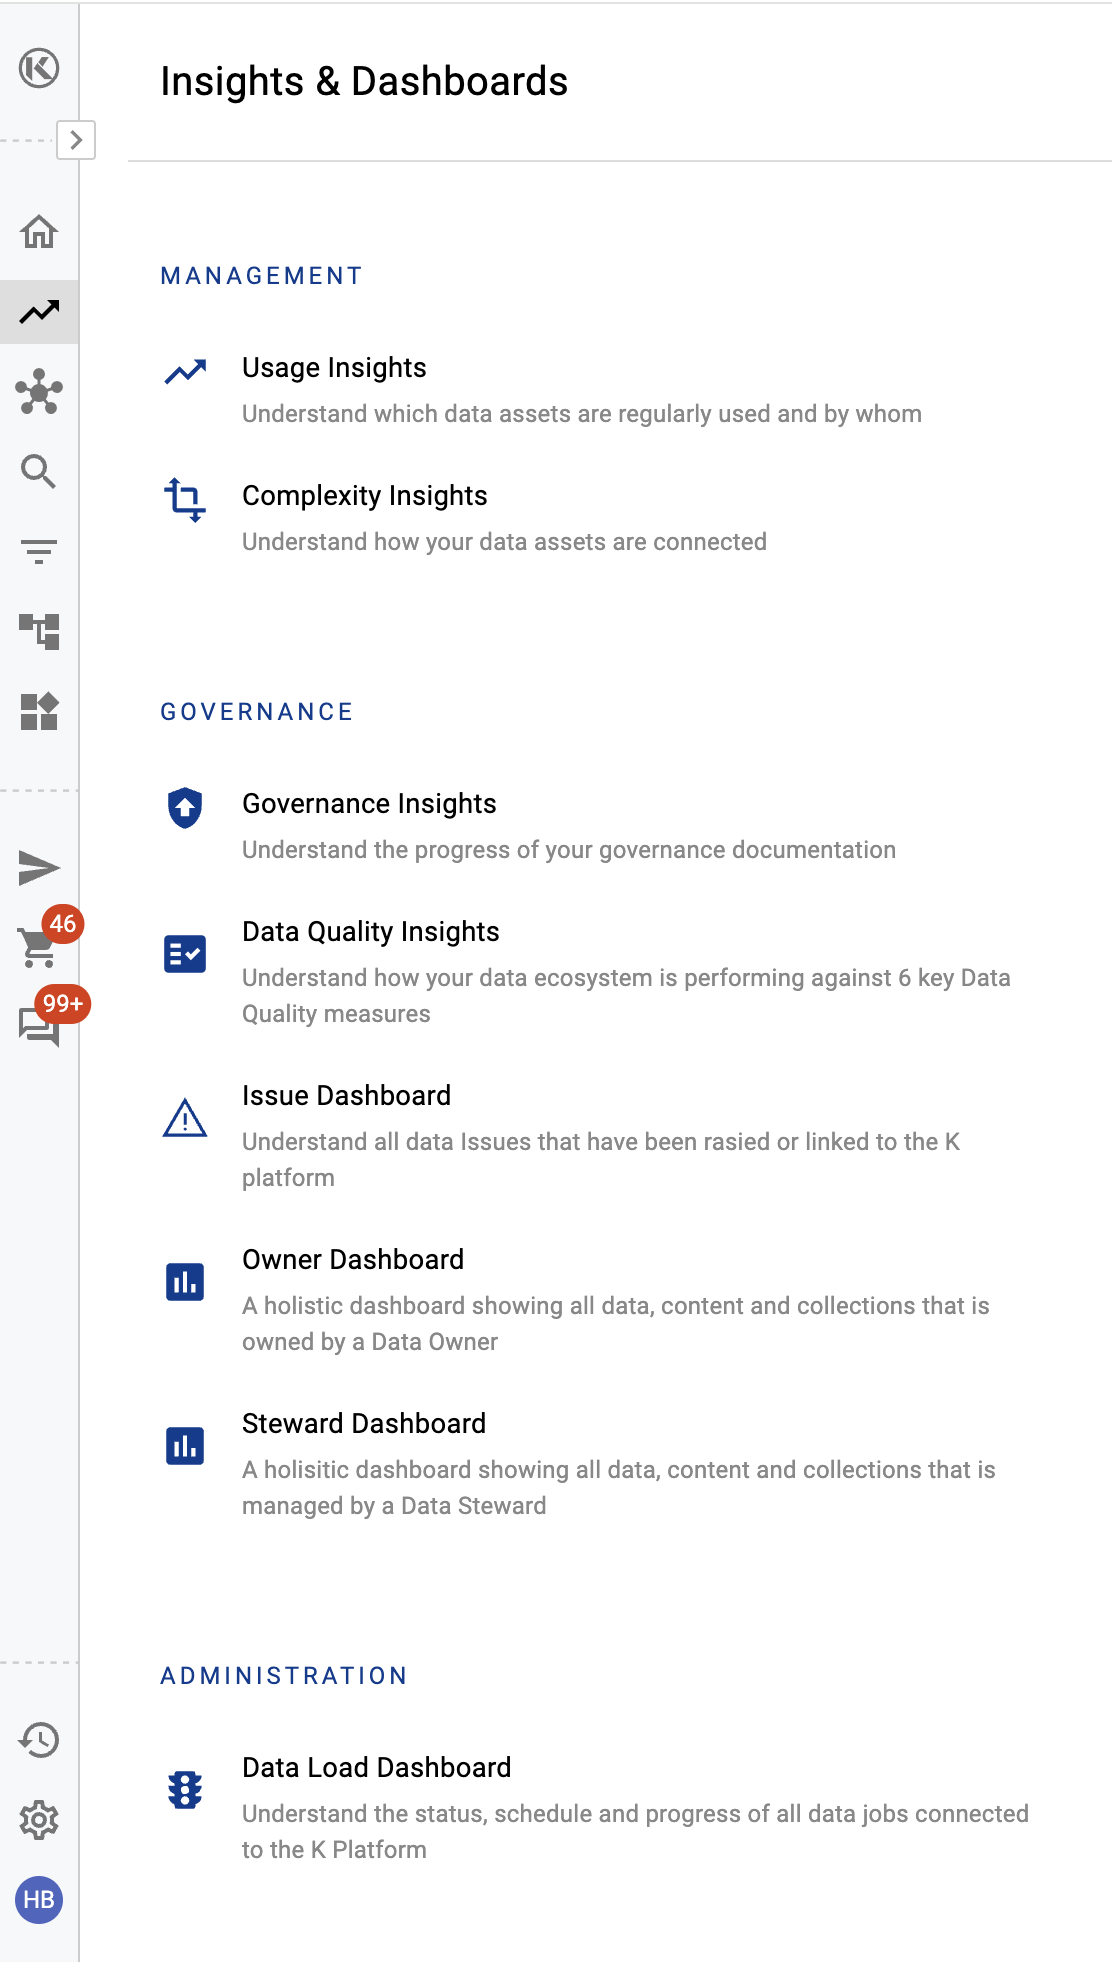
K has a number of helpful Dashboards and Insight pages to support Data Managers and Data Governance Manages to manage and govern the Data Ecosystem. These include:
You can also click on each chart to drill down to asset level detail.
Dashboard data is refreshed daily by default. Your K admin can specify a more frequent update schedule are run an adhoc refresh via Batch Manager in Platform Settings.
Insights and Dashboards are only accessible to Data Managers and Data Governance Users
Usage Insights
The Usage Insights page allows users to drill down on usage information for a specific source or tool. This can be particularly useful when planning migration activity.
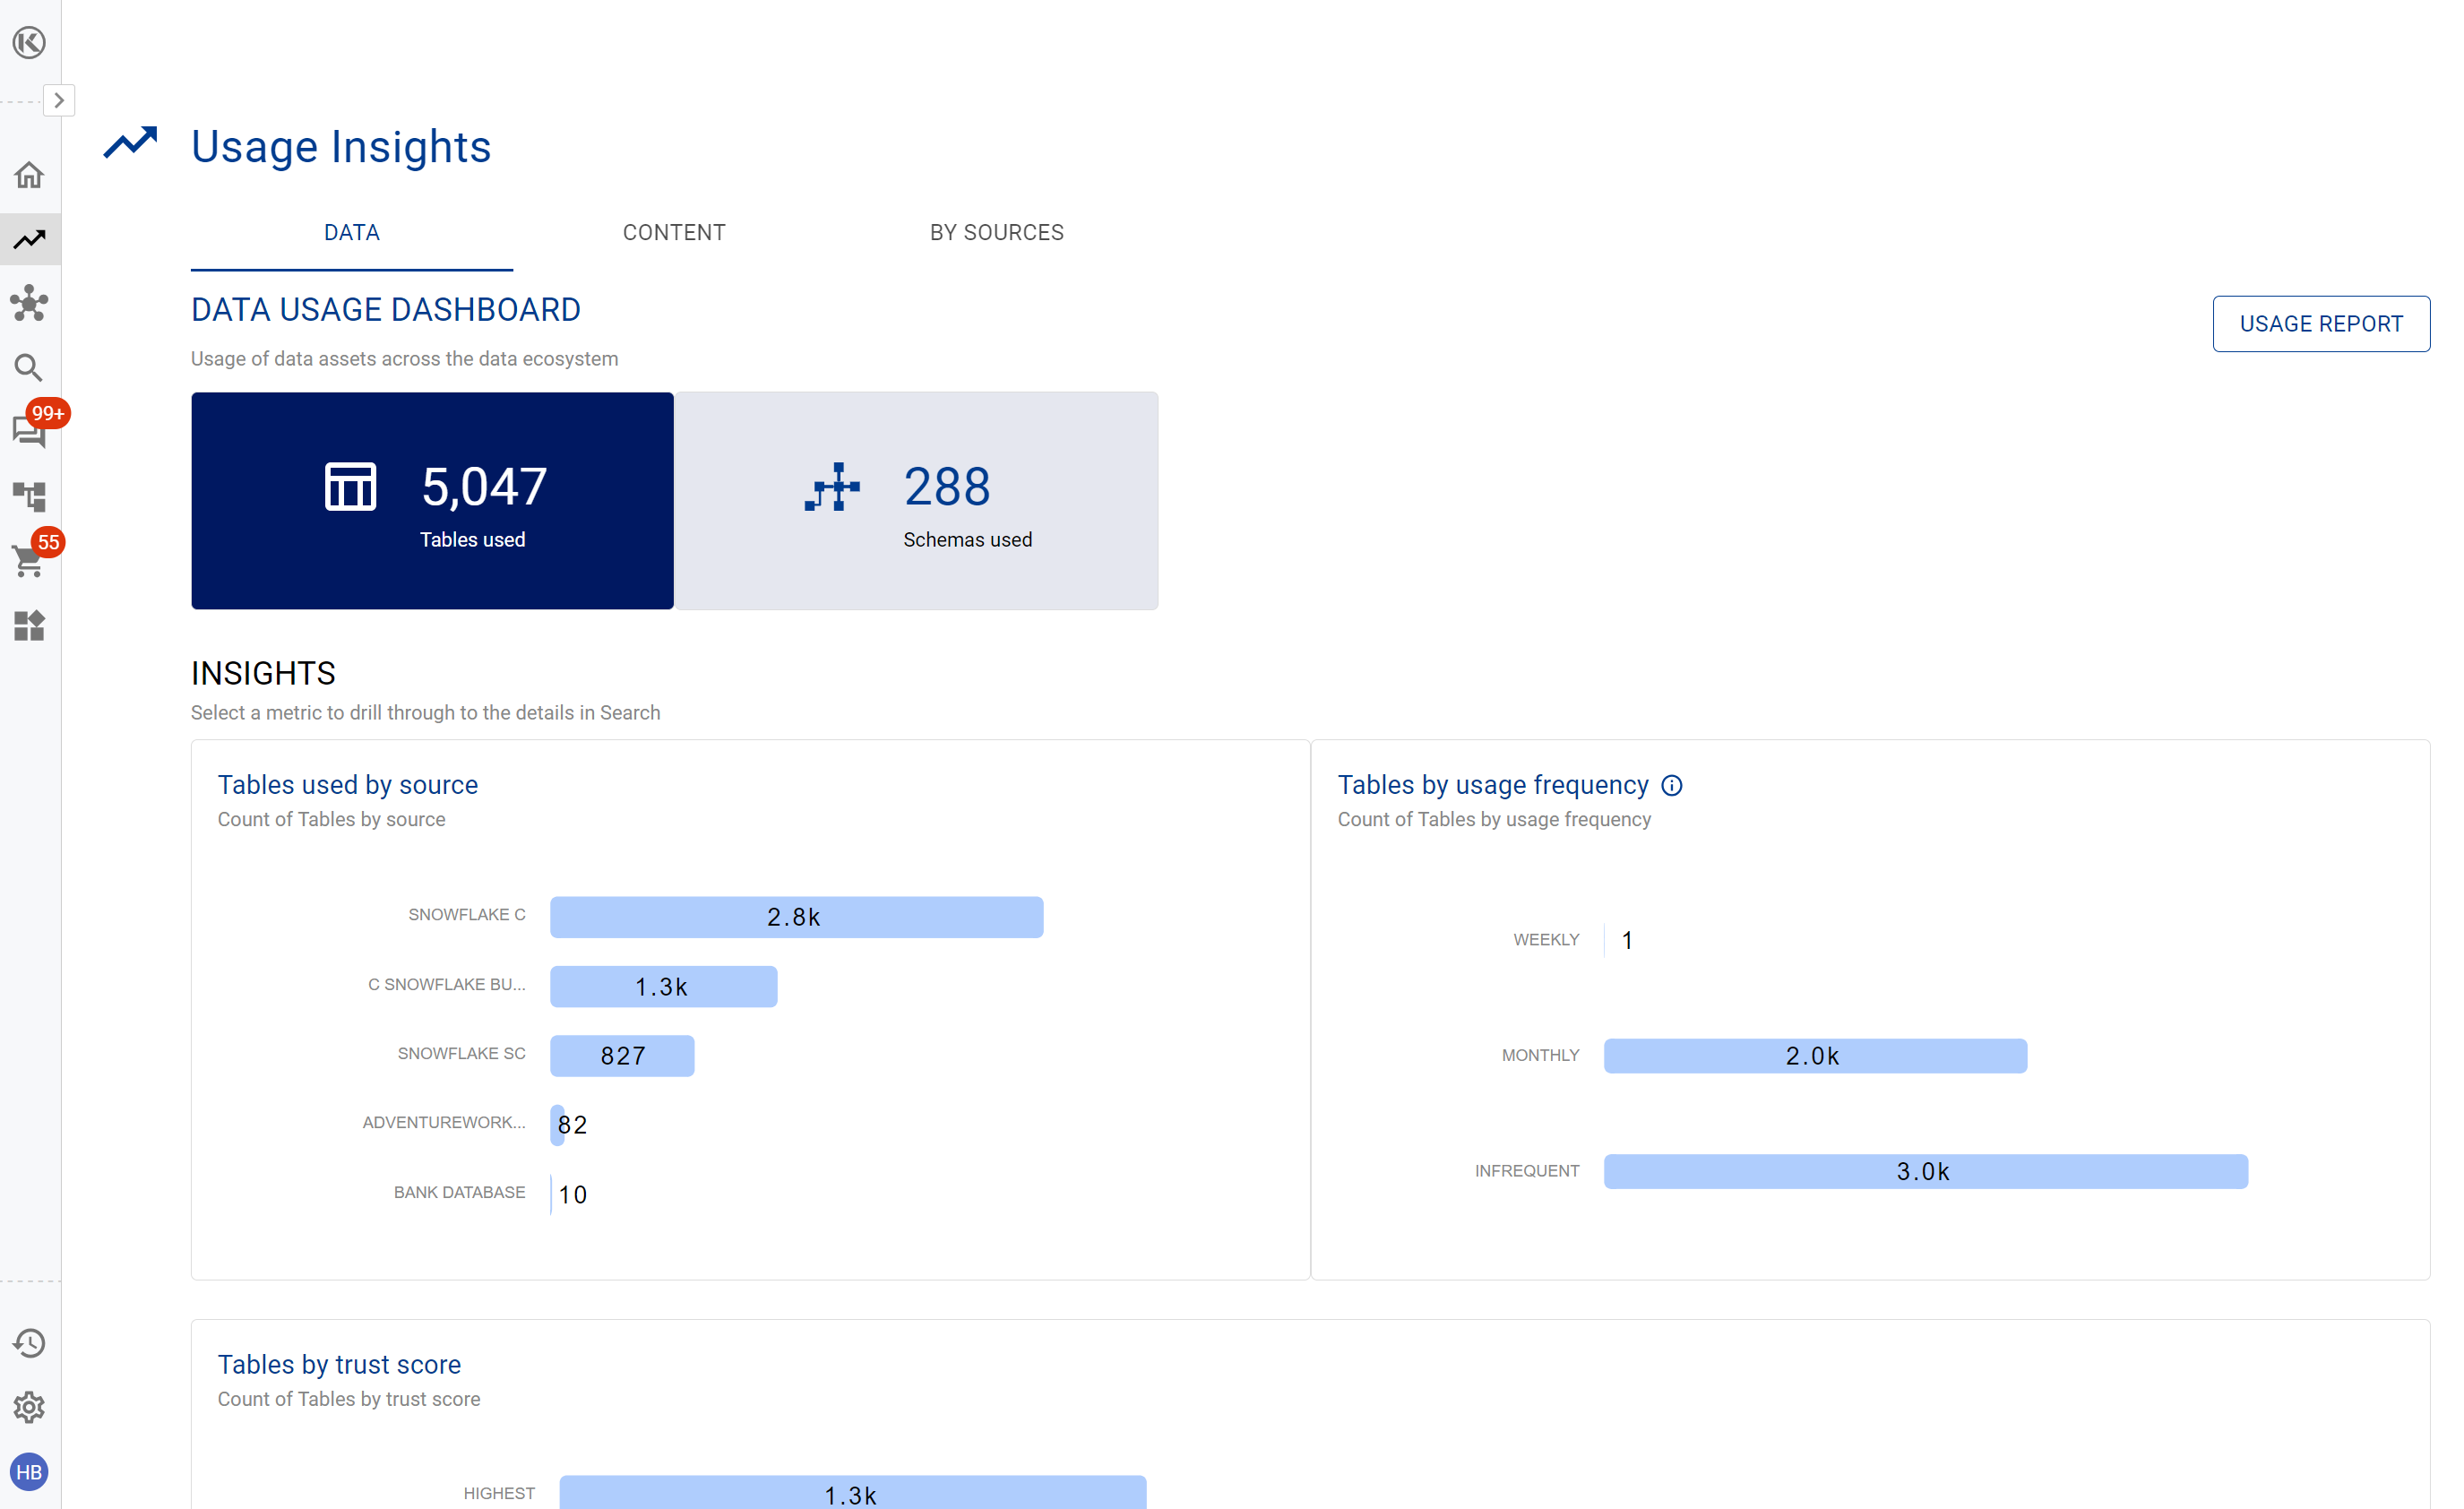
Below is a table explaining how usage is calculated.
Usage Frequency | Calculation Method |
|---|---|
Daily | Data asset was used 10+ weekdays over the last 3 weeks |
Weekly | Data asset was used in 3 different weeks over the last 4 weeks |
Monthly | Data asset was used in 3 different months over the last 4 months |
Infrequent | Data asset was used at least once within the last 4 months |
Unused | Data asset has not been used within the last 4 months |
Complexity Insights
Use the Complexity insights to understand how connected your data assets are to each other
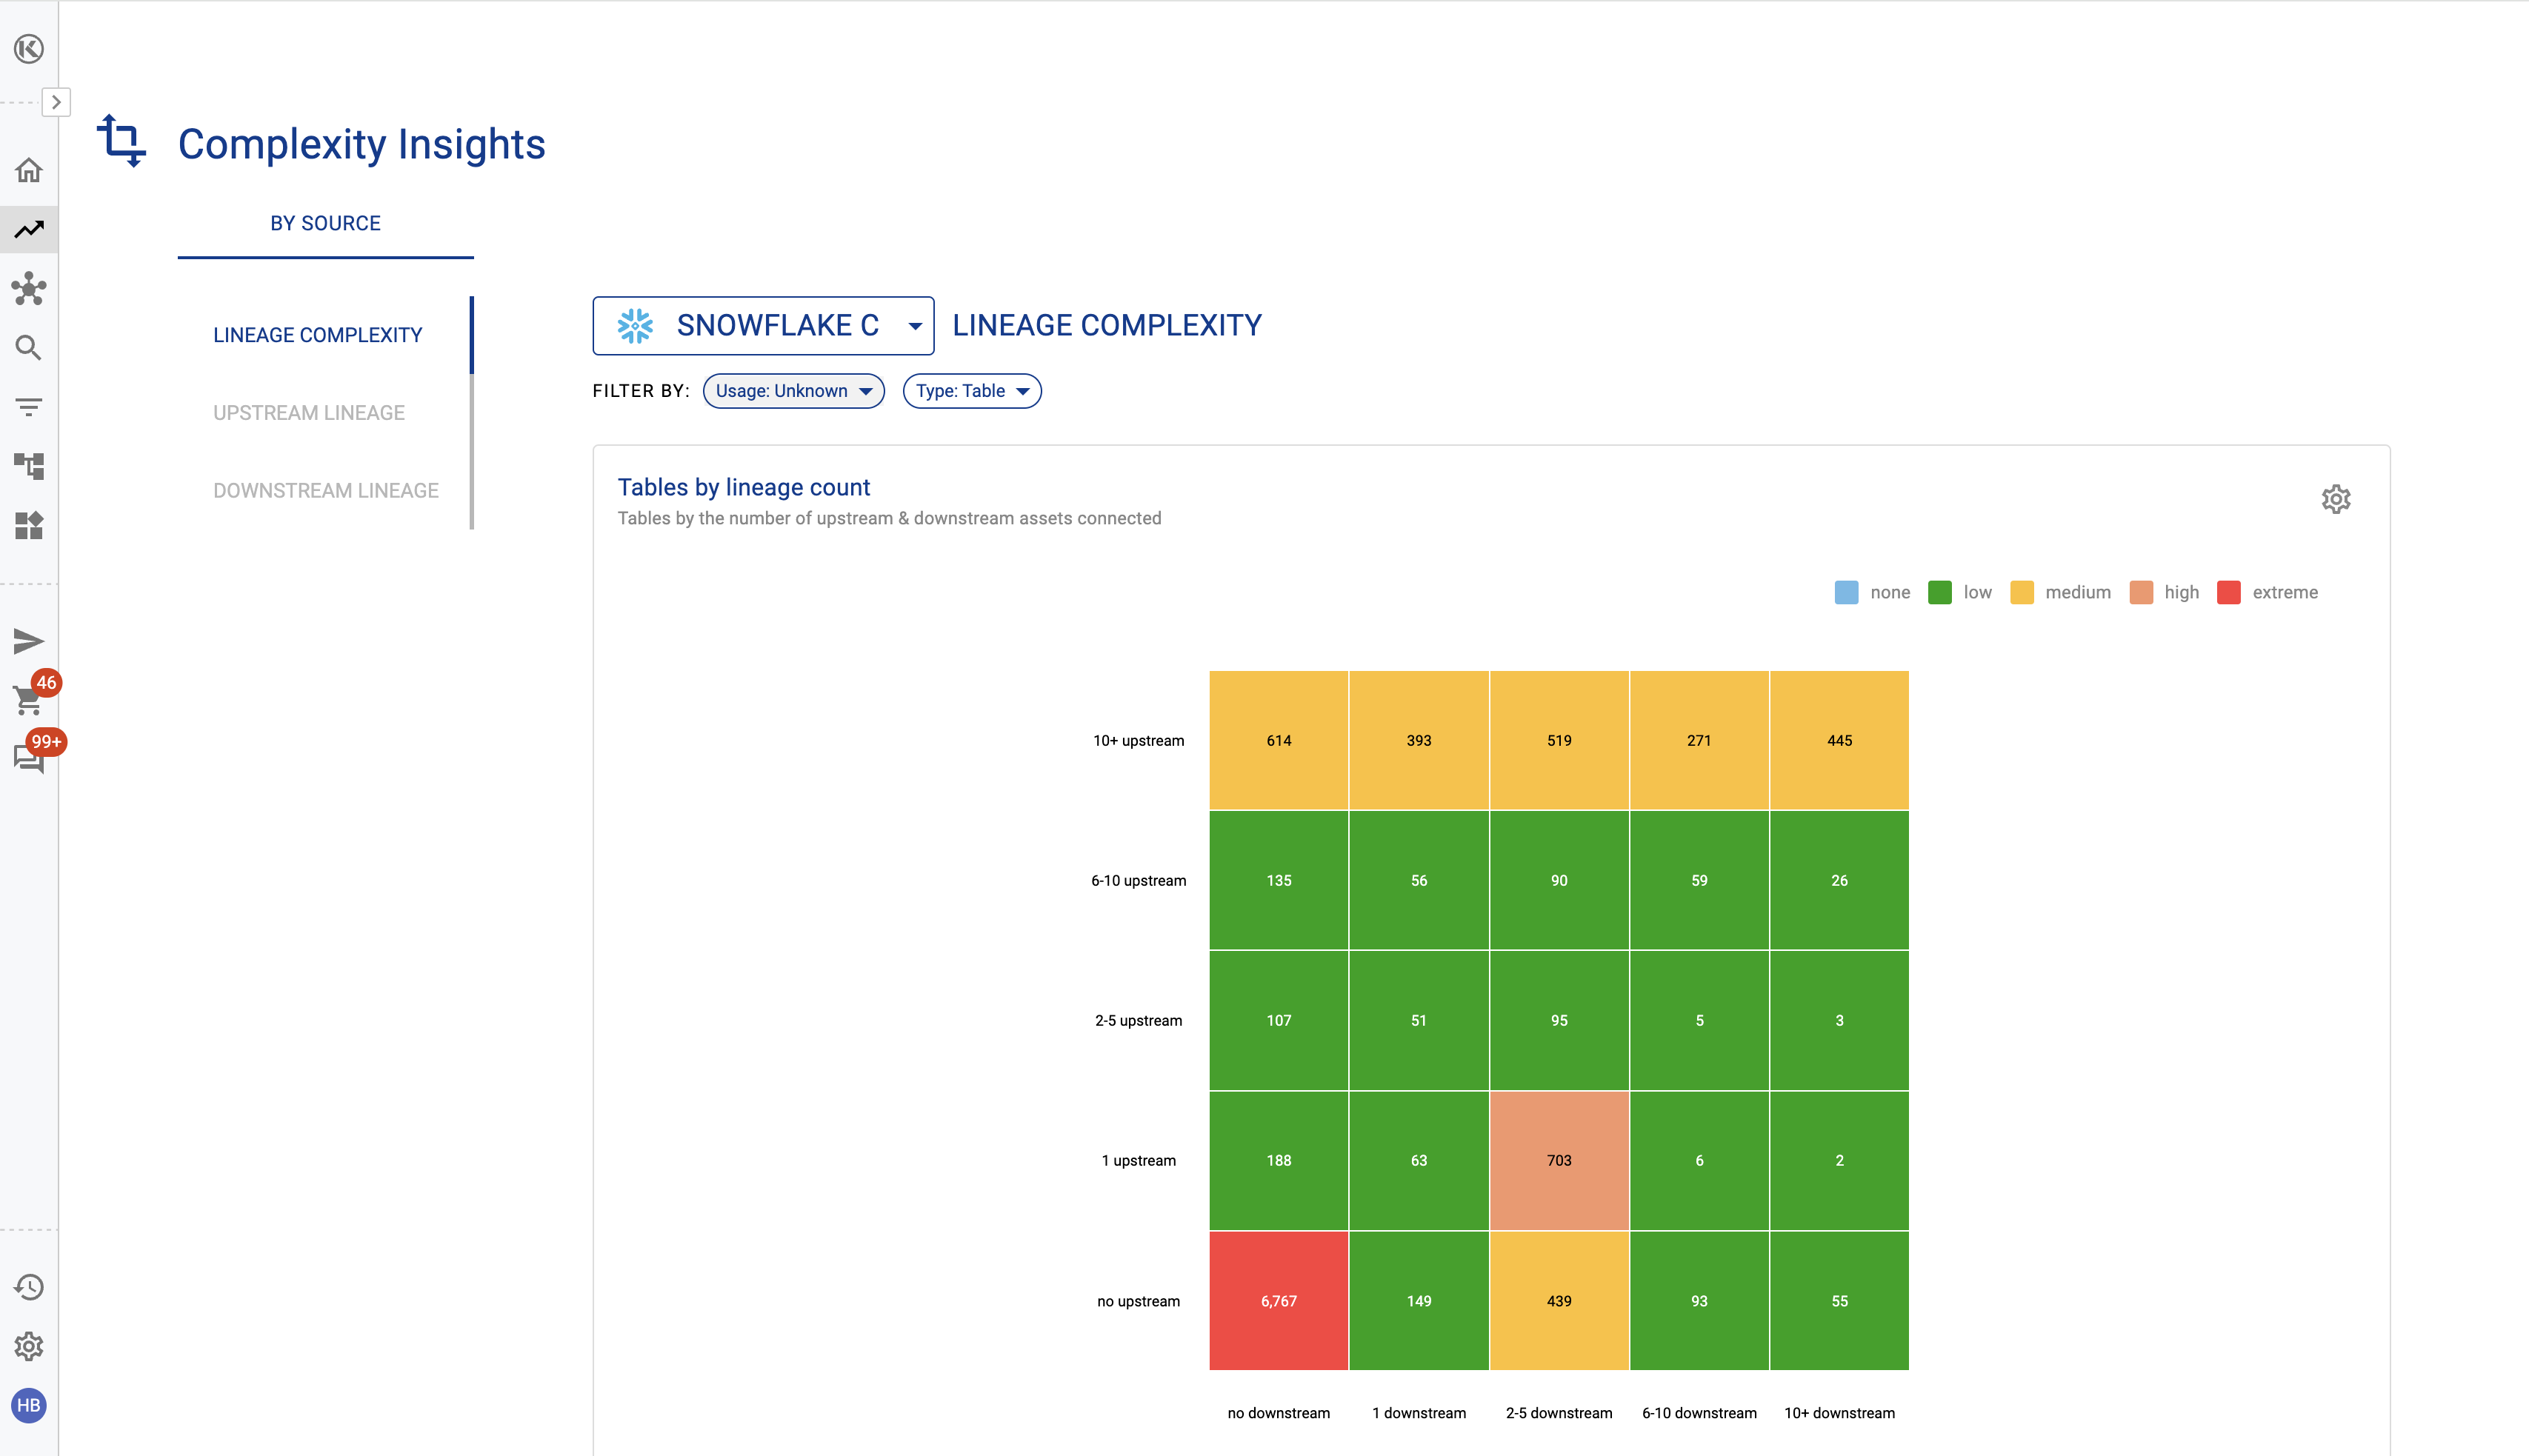
You can select different views including both upstream/downstream complexity or just upstream or downstream.
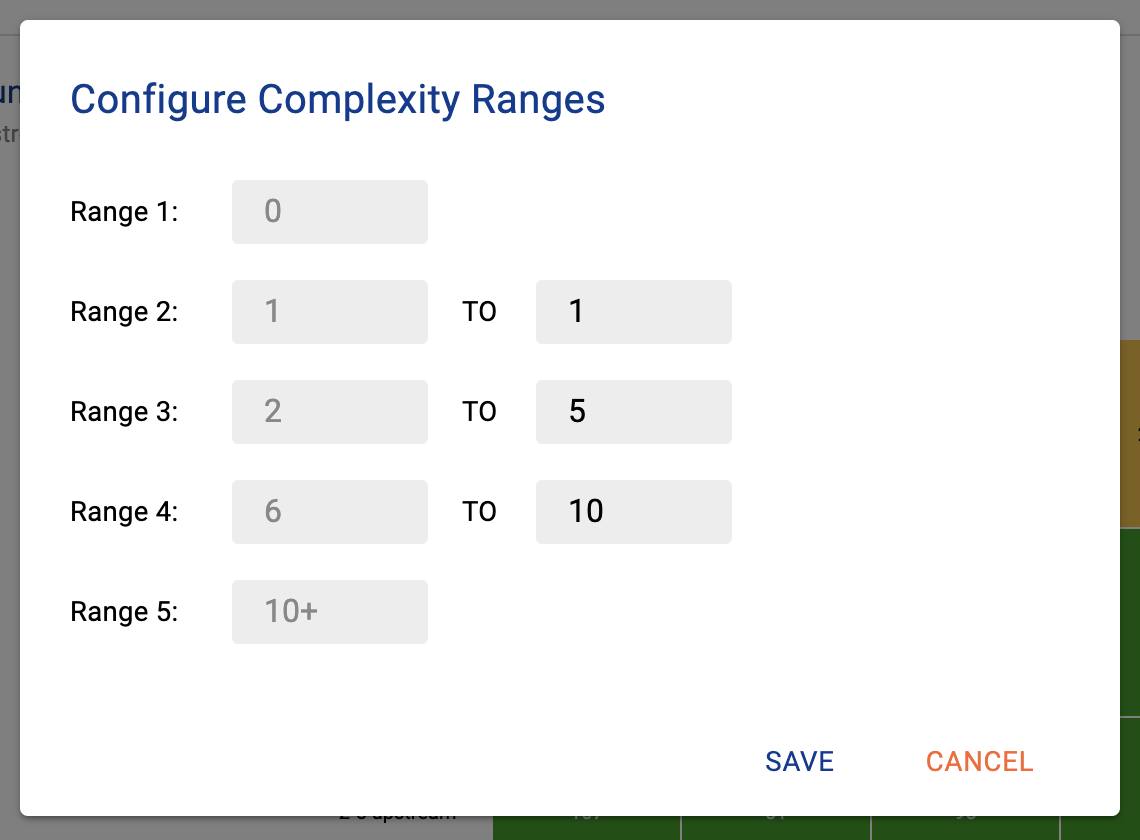
You can also customise the ranges of complexity by selecting the settings icon on the right hand side.
Governance Insights
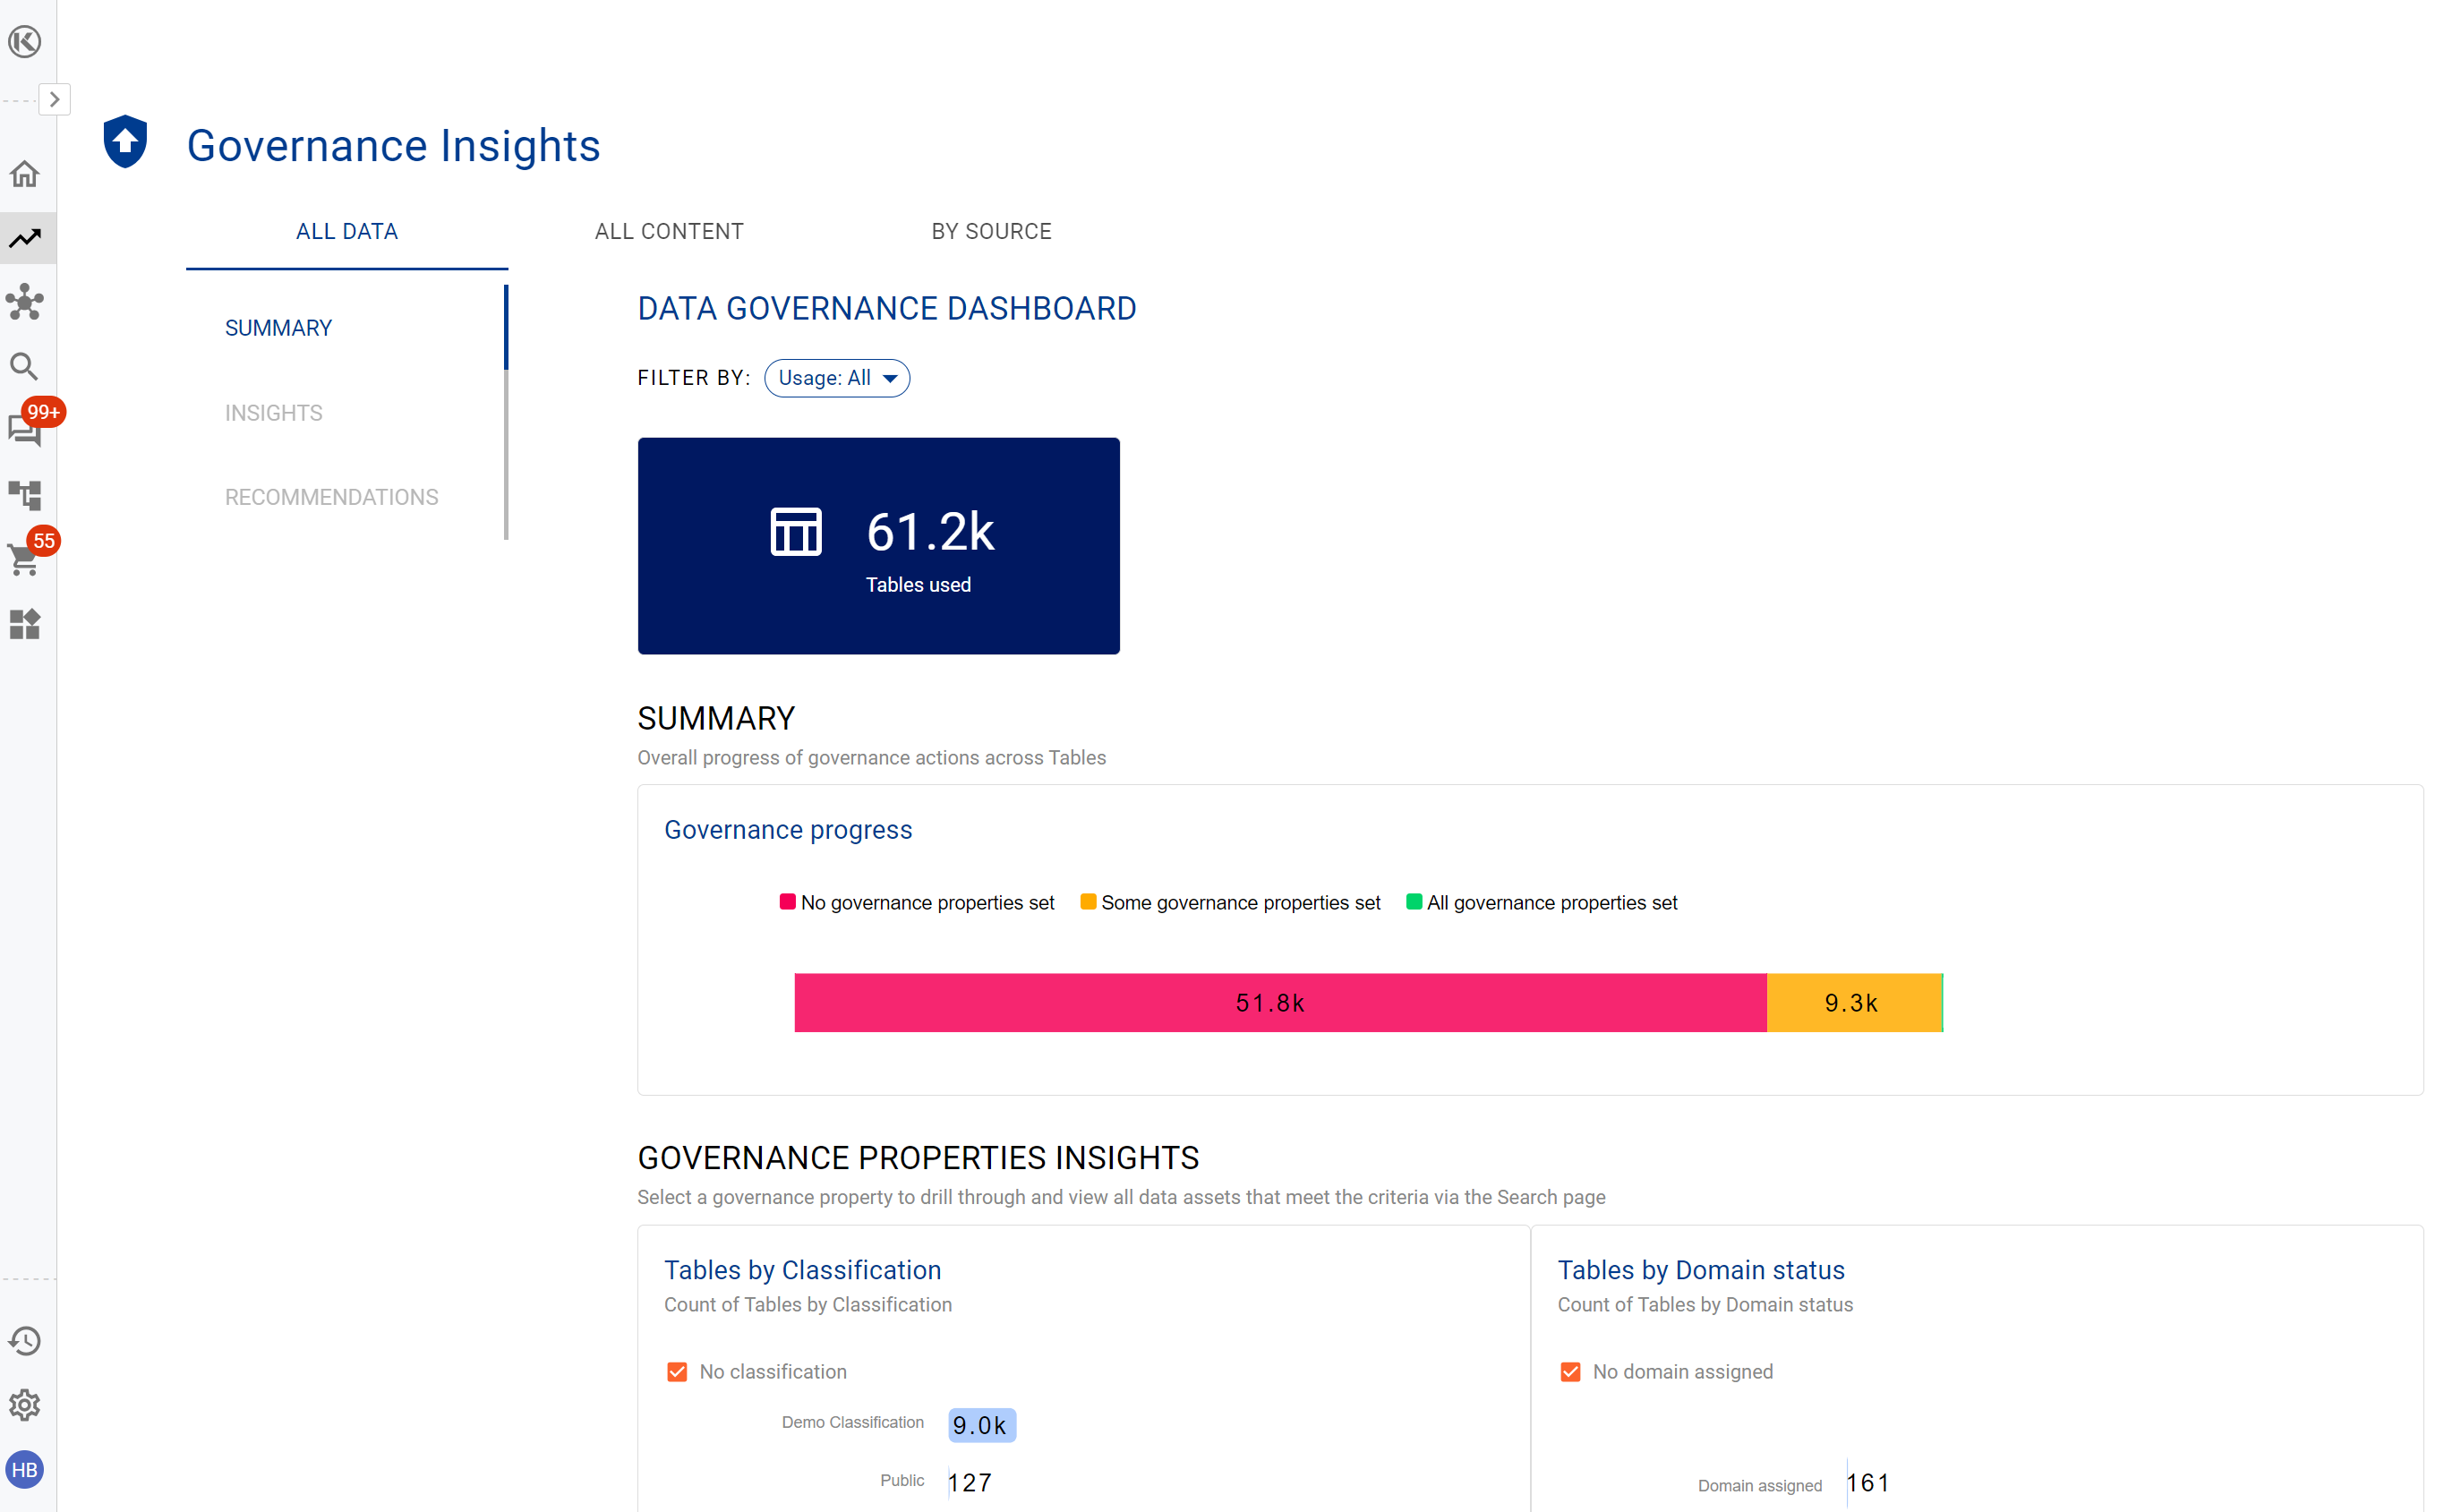
Use the Governance Insights to track classifications, ownership and lineage quality across data assets that are being used.
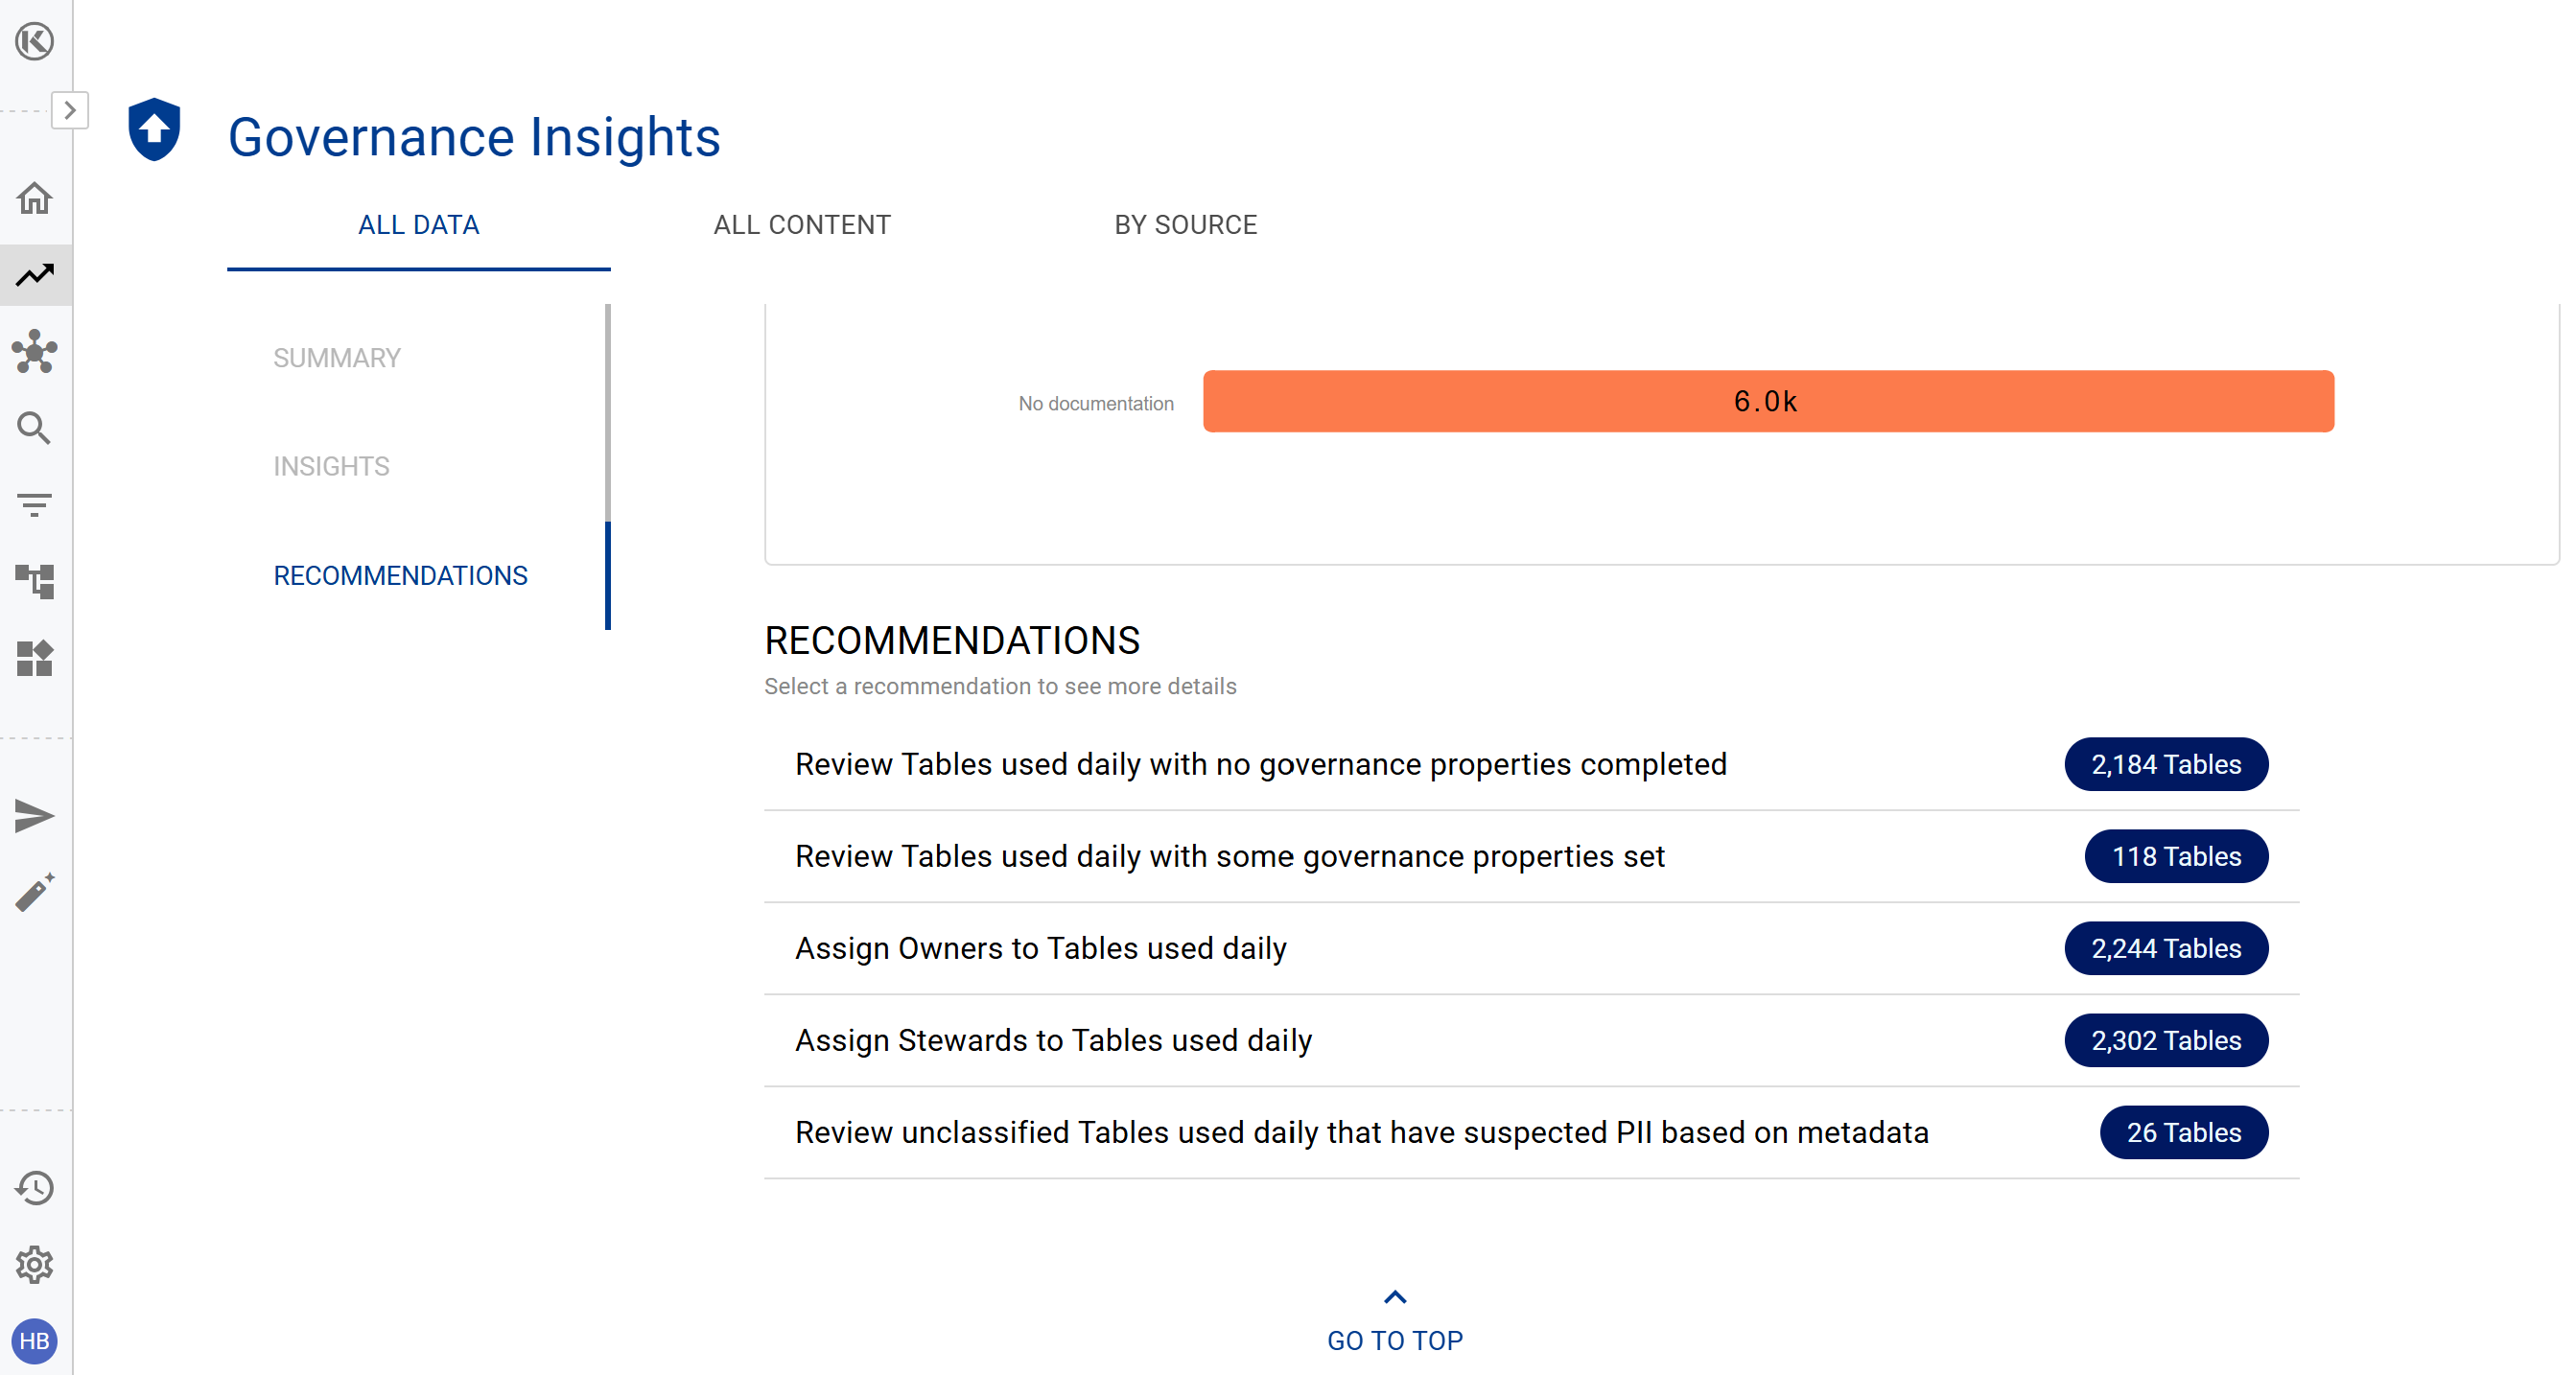
At the bottom of the Governance Dashboard also provides helpful Recommendations one data assets for review and data assets missing Data Owners or Data Stewards.
Data Quality Dashboard
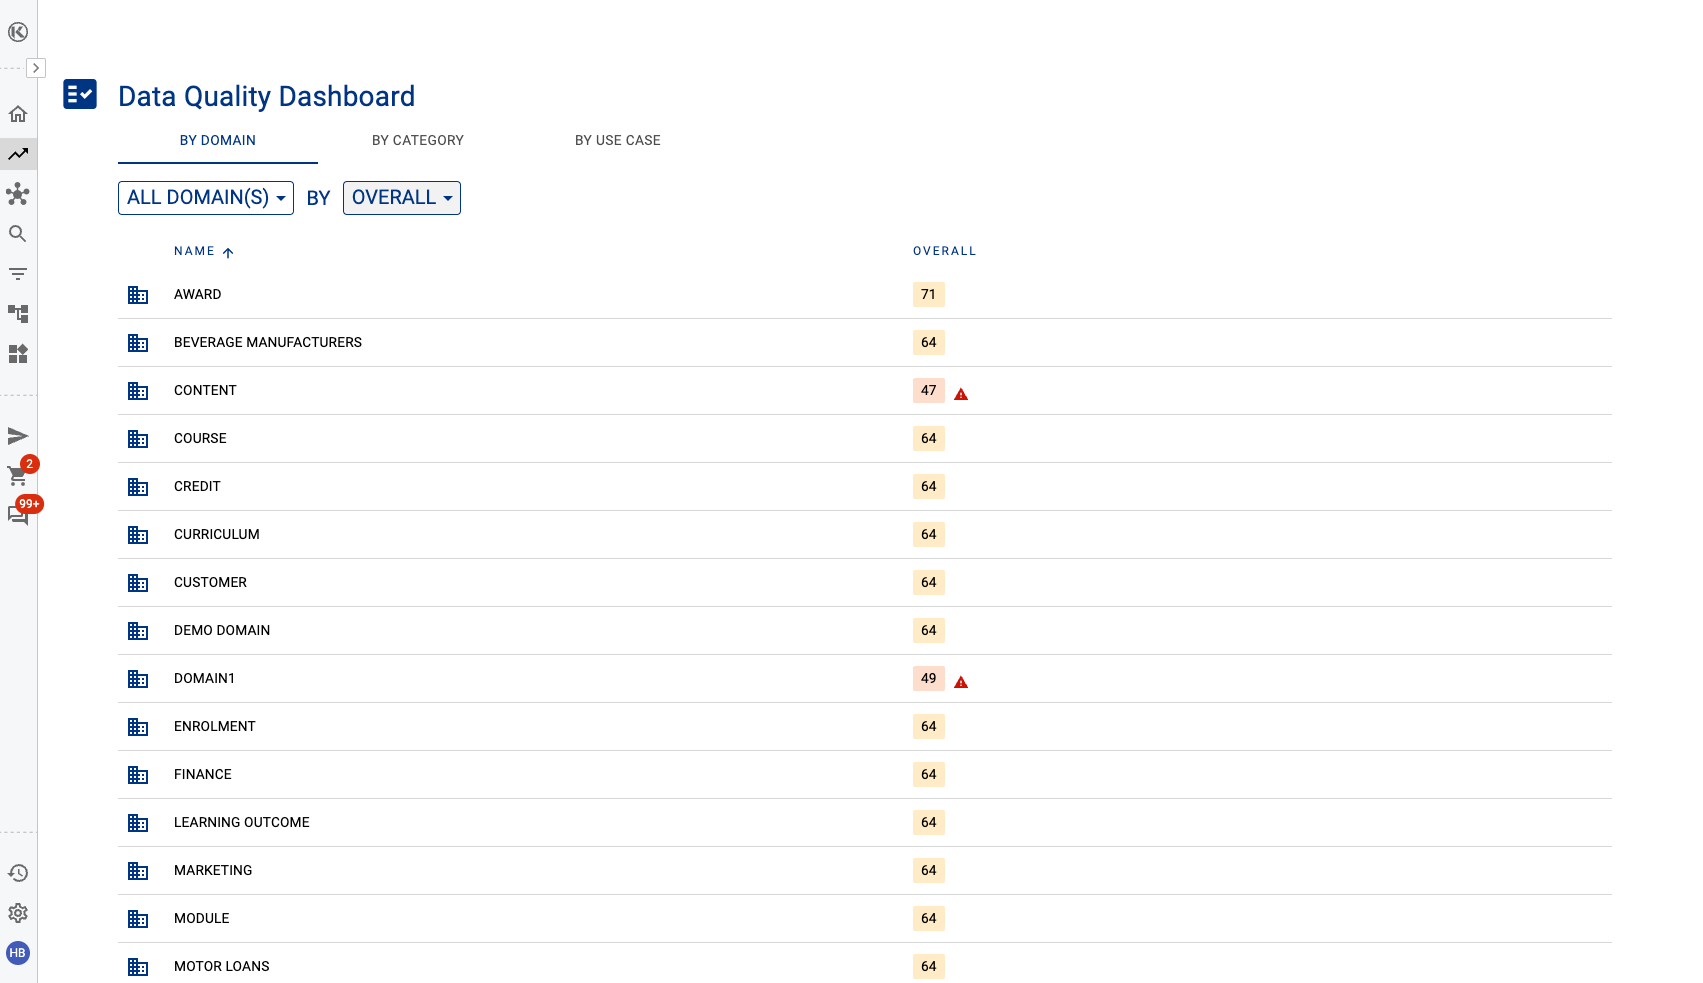
The Data Quality Dashboard provides an overview of data quality across domains, category and use case. Use this dashboard to compare DQ across domain, category and use cases.
Data Quality Insights
The Data Quality Insights provides an overview of data quality across the ecosystem. Drill through to DQ by Source, Domain, Collection or DQ tool.
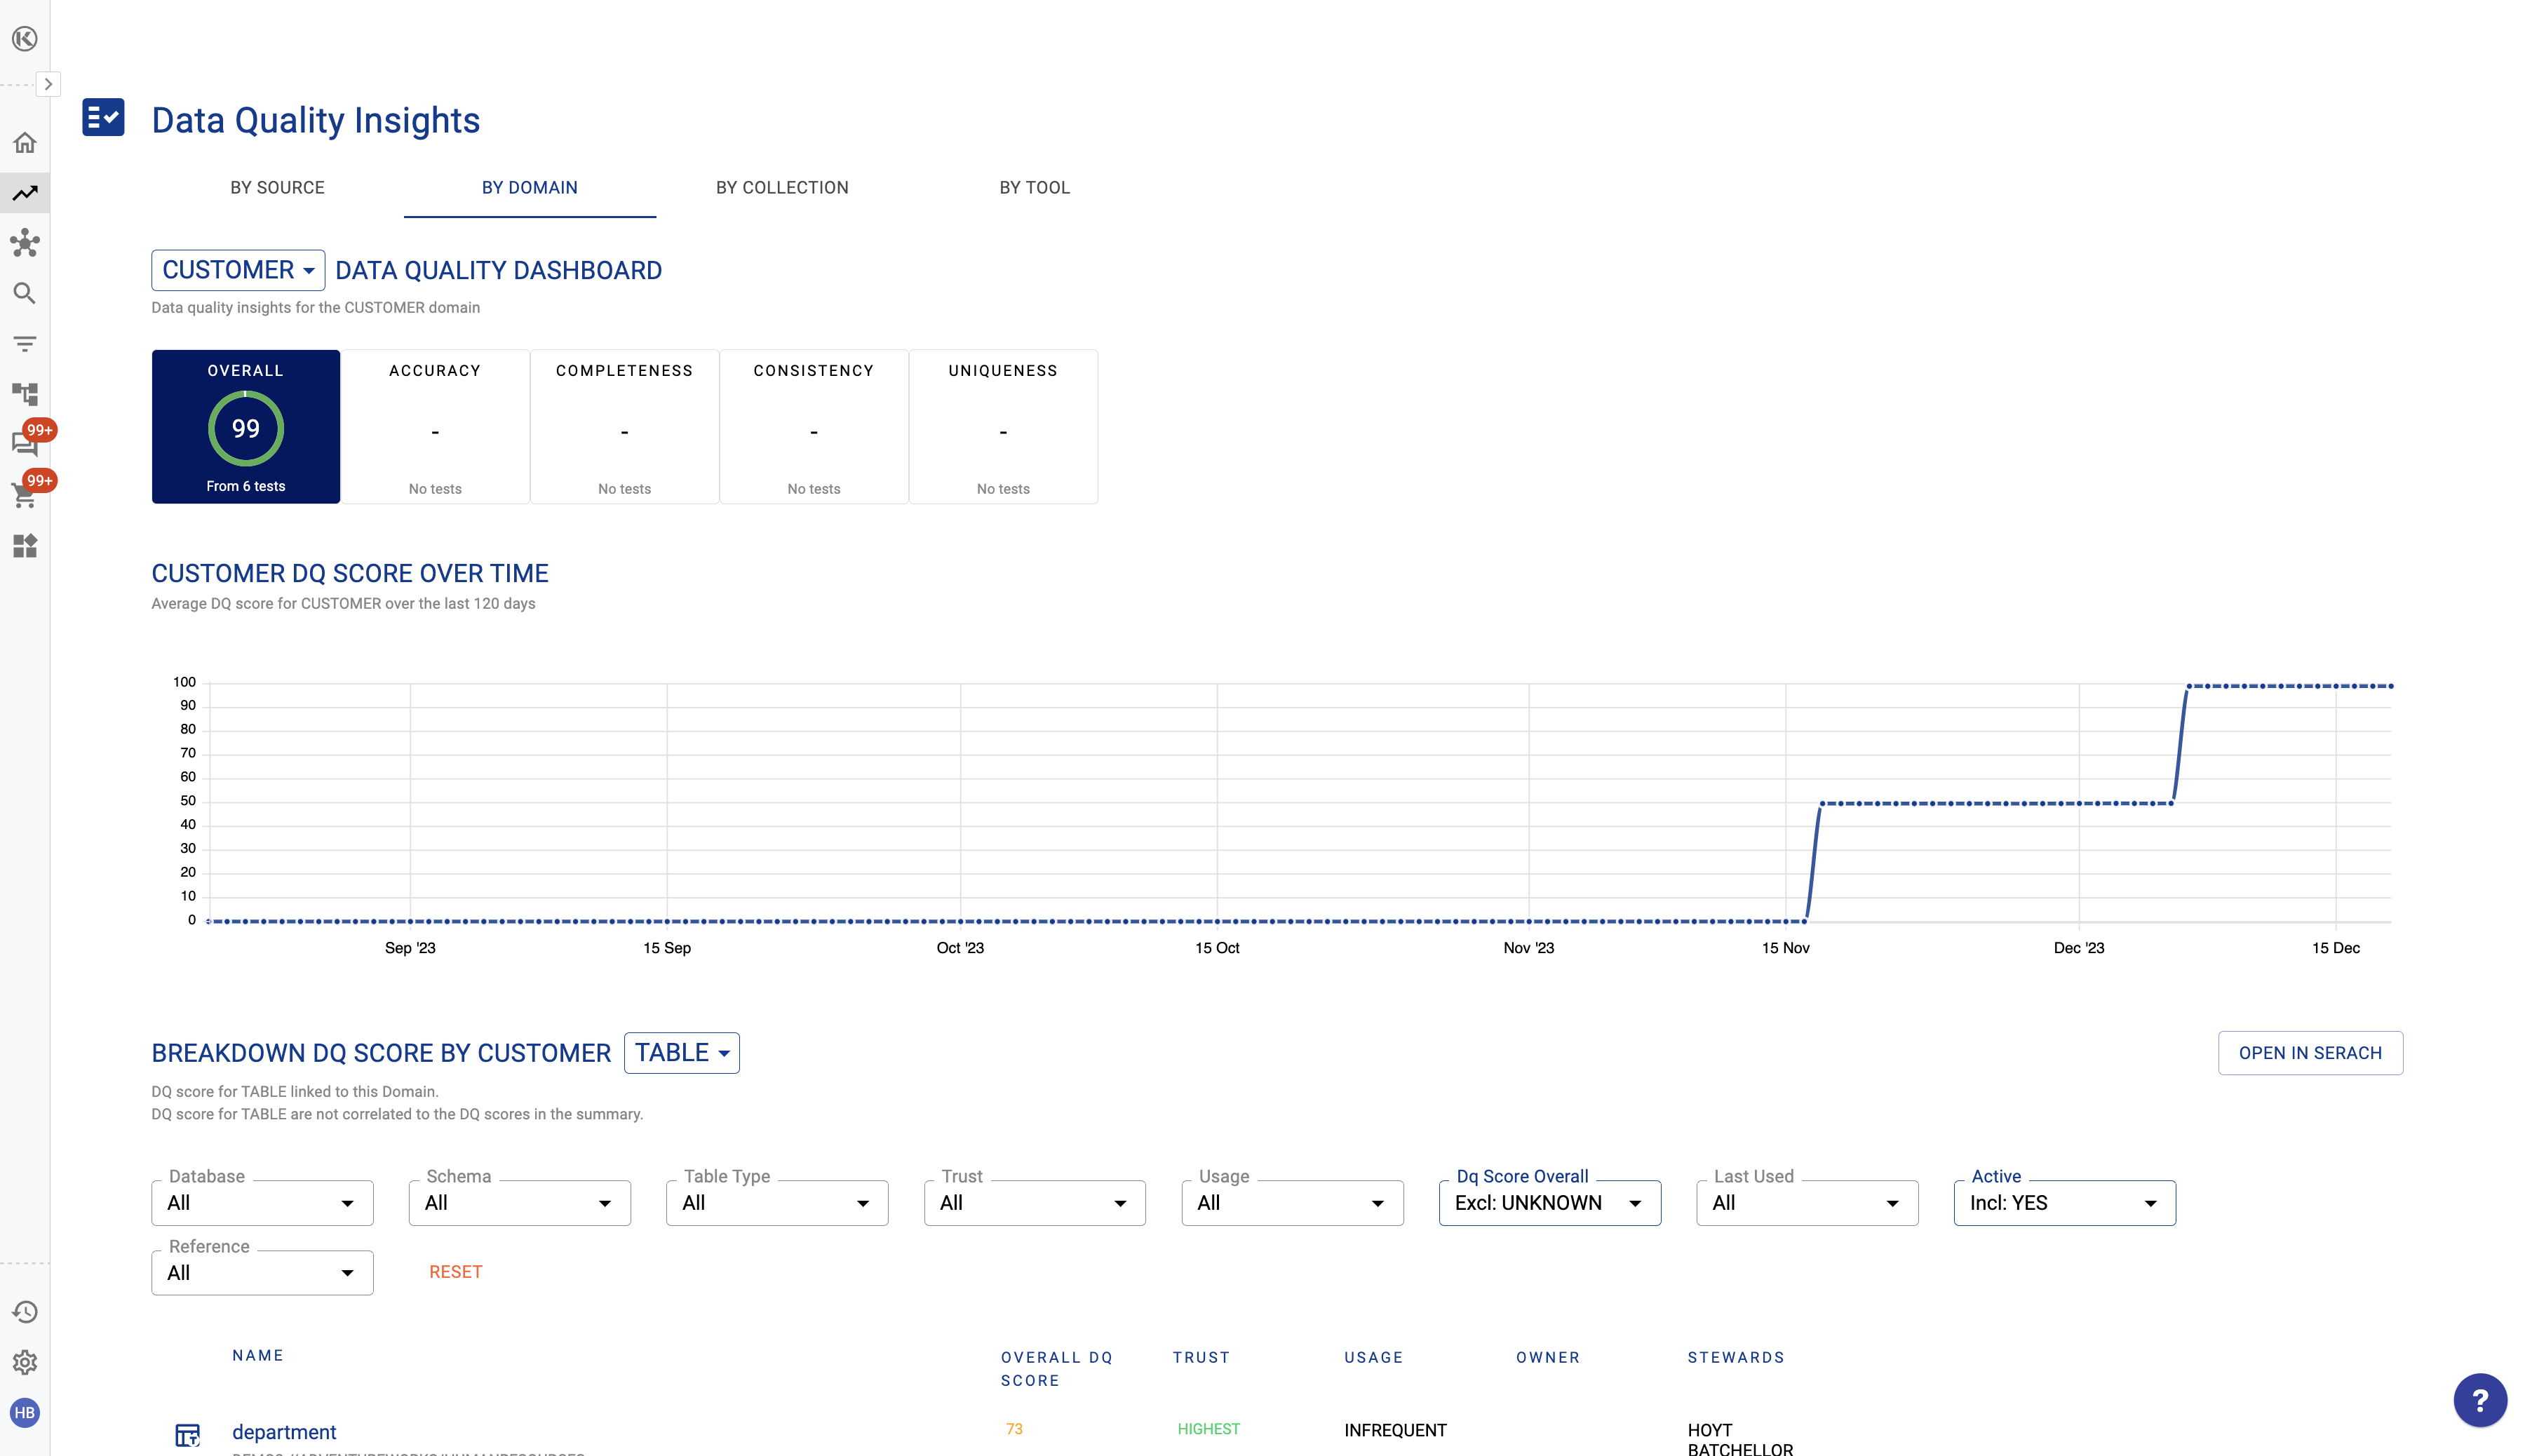
Select a specific domain, or collection to drill through to details about DQ for assets that belong to that domain or collection.
Issue Dashboard
The Issue Dashboard provides key summary insights about data issues raised in K. To further tailor the insights, you can filter the Dashboard by Domain, Status and Priority.
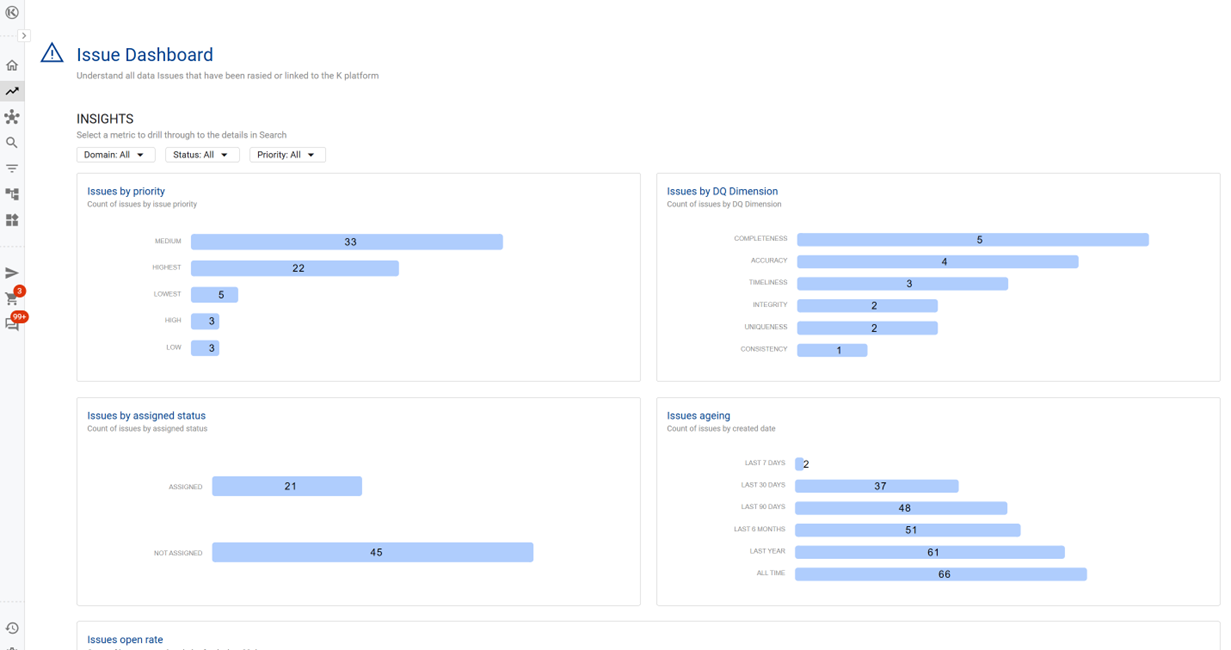
When you click on any of the data points, a pop up will appear listing all the data issues. Click on the issue name to access issue details or you can click Open in Search to view all issues and download a copy

At the bottom of the Dashboard, there are also helpful recommendations on issues you may want to further investigate or have aged and require follow-up. These recommendations also adjust based on the filters you set at the top of the Dashboard.

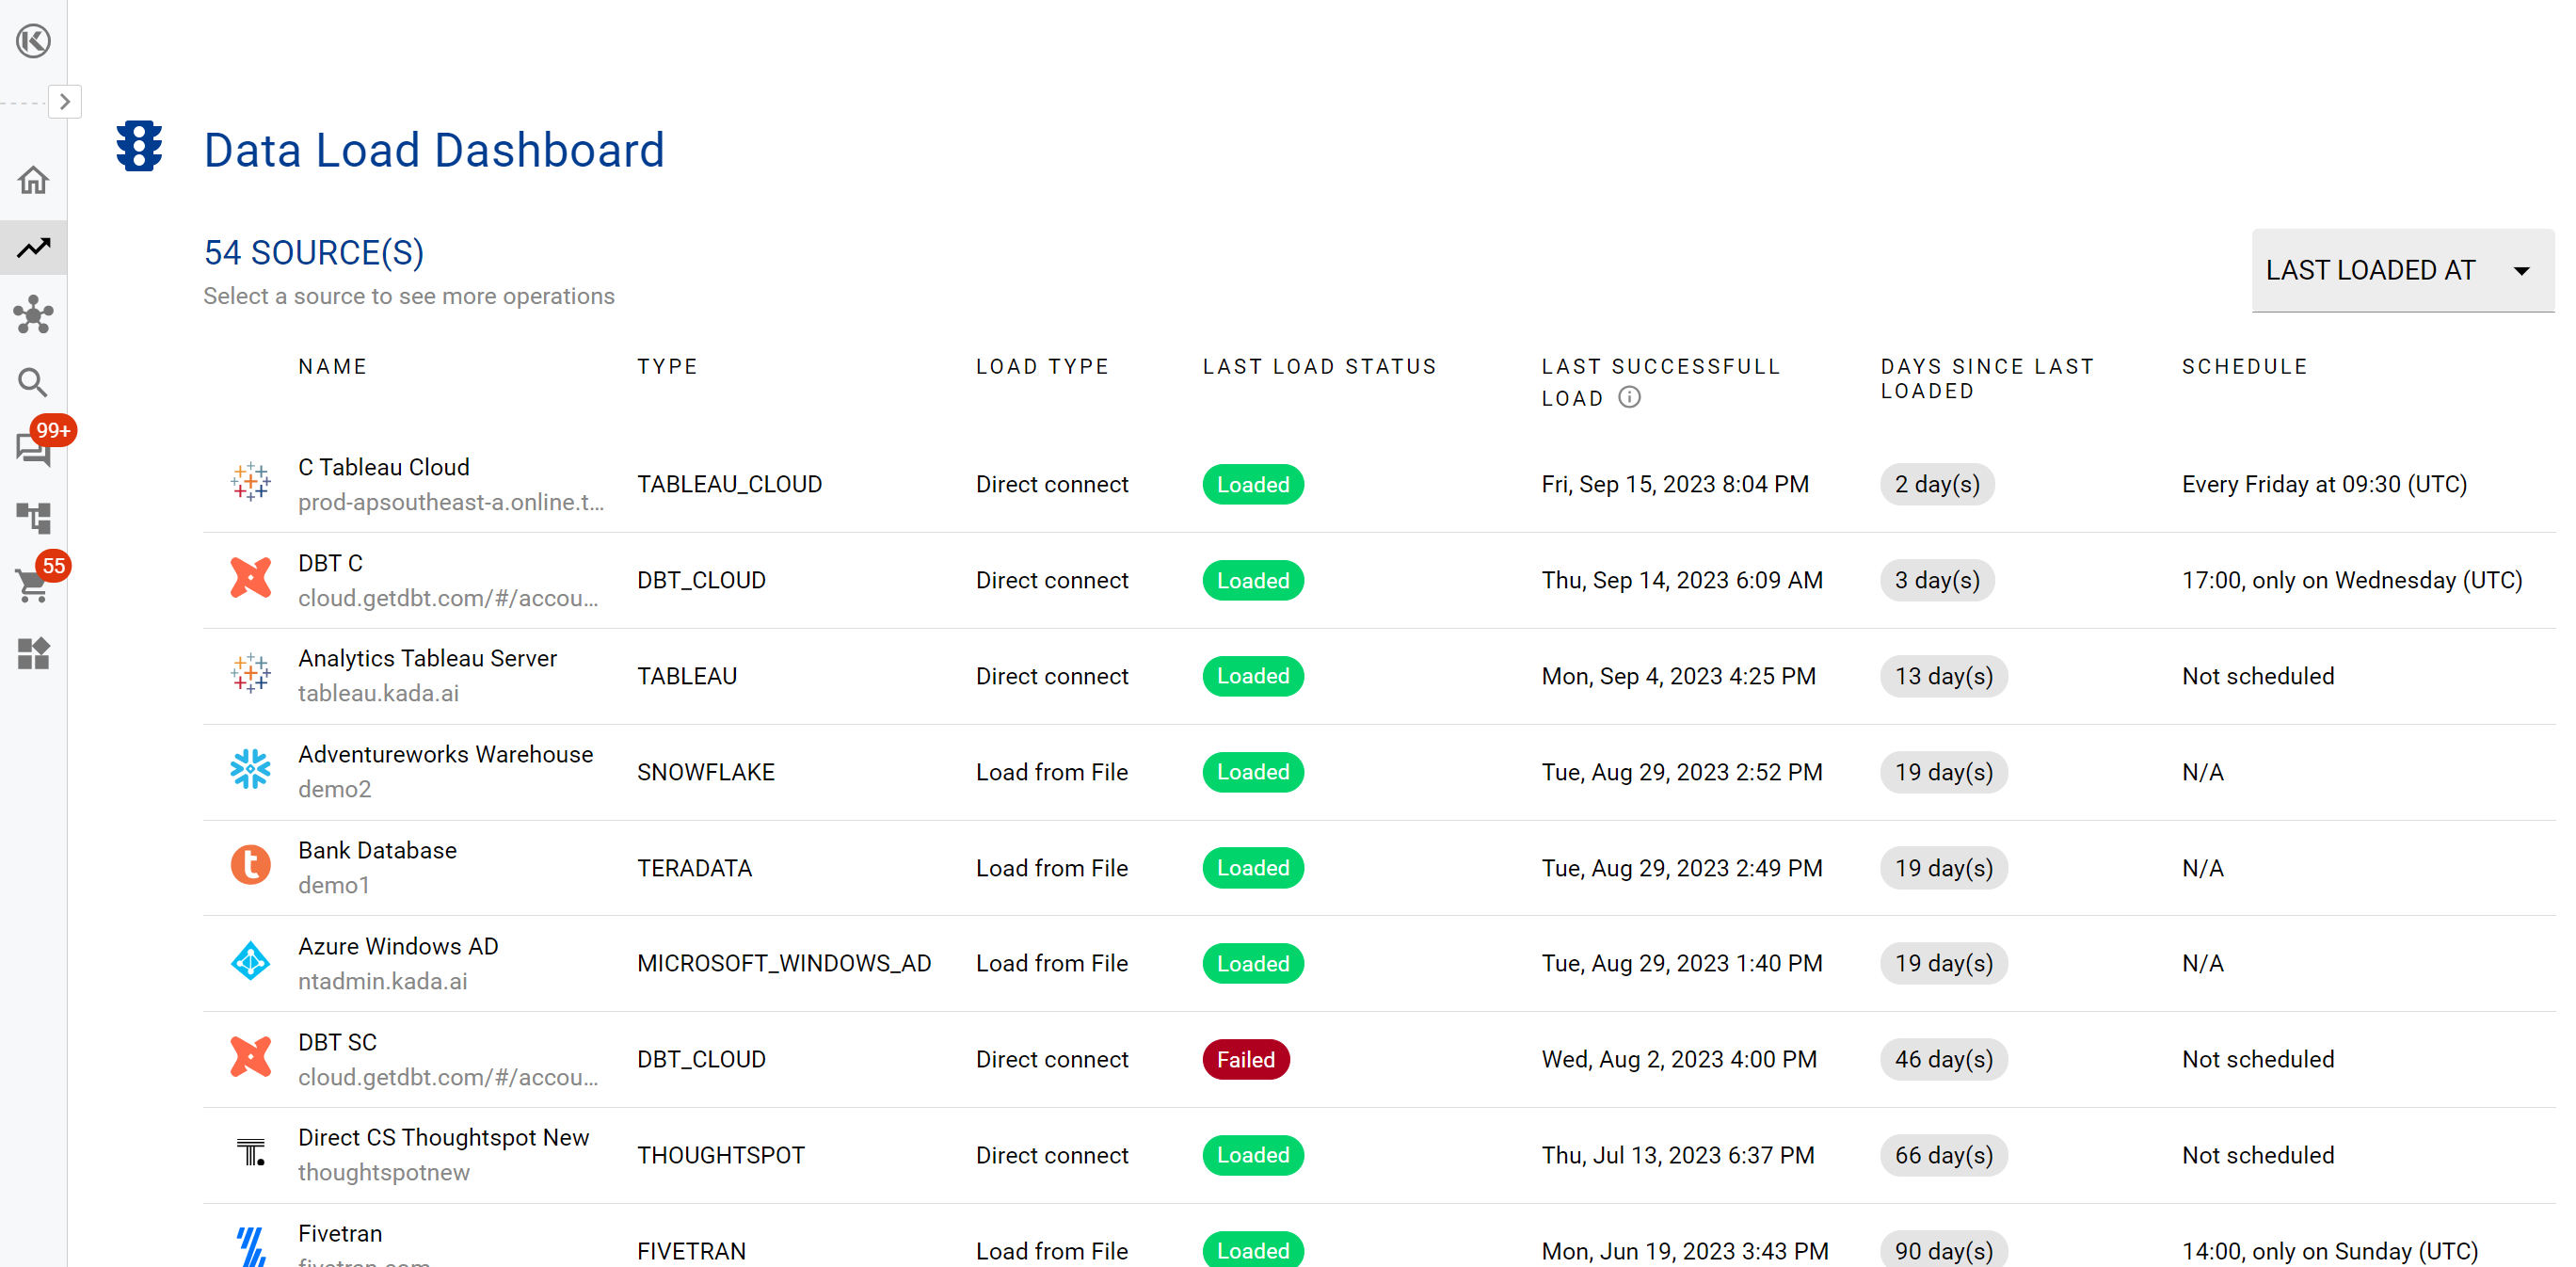
Data Load Dashboard
Use the Platform Load Dashboard to see the current state of source loads into K.
Data Owner and Data Steward Dashboards
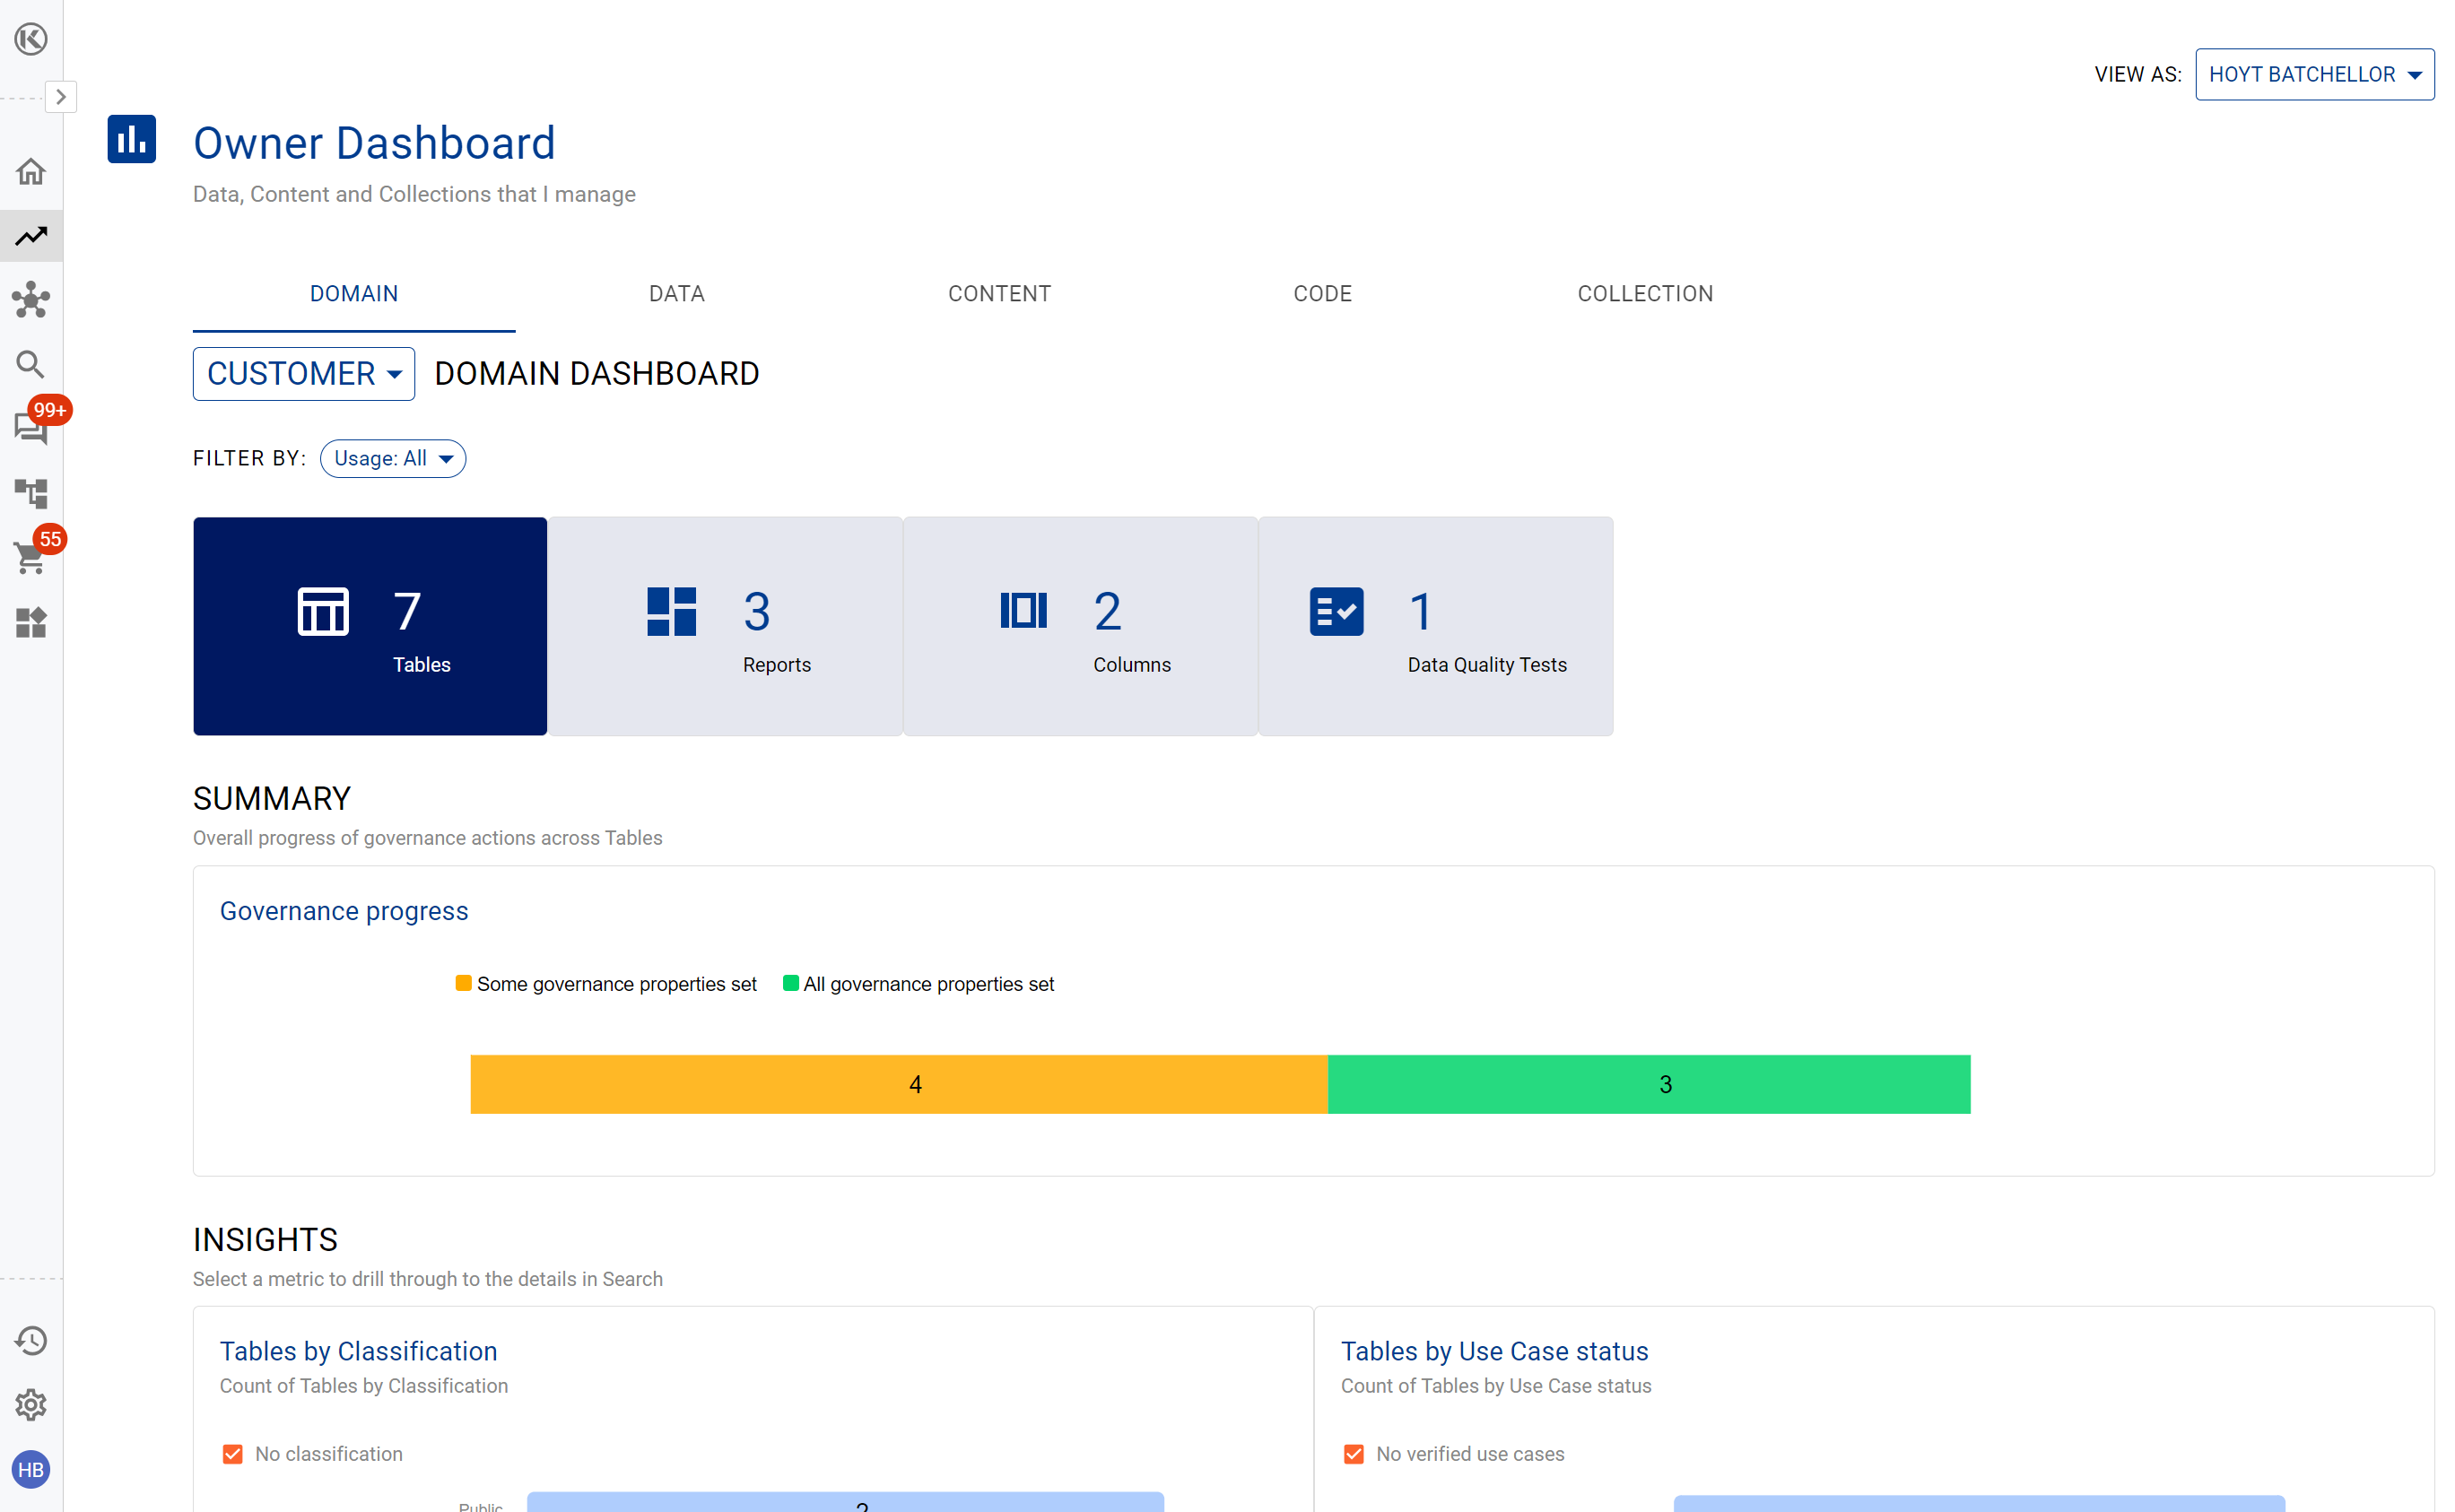
The Owner Dashboard displays all of the data items that a Data Owner or Data Steward manages and provides a snapshot of key governance and quality metrics.
Tips on how to make the most of Insights and Dashboards
Insights and Dashboards | Scenario | How K can help |
|---|---|---|
Usage Insights | Your are planning a migration activity | Selecting the data source, you can explore how heavily it is used and which are the key teams you need to engage. |
Governance Dashboard | You want to track the overall progress against Data Governance KPI’s | Identify gaps to address across your data assets that matter (used) vs. data assets that do not matter (unused). |
Data Quality Dashboard | You want to track DQ trends across critical domains | Identify which assets within a domain are creating significant impacts to data quality. |
Issue Dashboard | You want to identify the current state of data quality issues crowd sourced by your Data workforce | The Issue Tab provides a overview of all the current issues raised in K. Download a report to see all issues and their current status. |
Data Load Dashboard | You want to check the current state of the K platform. | Use the Platform Tab to see the current state of source loads into K. |

