Embedded Governance
Embedded Governance helps you include critical governance information directly the reports and dashboards that are used by the business.
Using K, you can generate code that can be directly embedded into the report canvas (e.g. Power BI or Tableau). This code will present information such as the report category and report owner that has been configured in K.
What’s in the Governance Embedding?
The governance widget is an embedding that can be placed directly in supported BI tools to display critical governance information where the data consumer works. The embedding is live, with any changes and notices added in K appearing in the BI tool in real time.
The data widget can be shown in two formats:
Detailed: The detailed embedding provides a comprehensive view of critical information about this report. Use this option to present a detailed summary page within the report / dashboard The profile requires a min width of 800px and a min height of 800px.
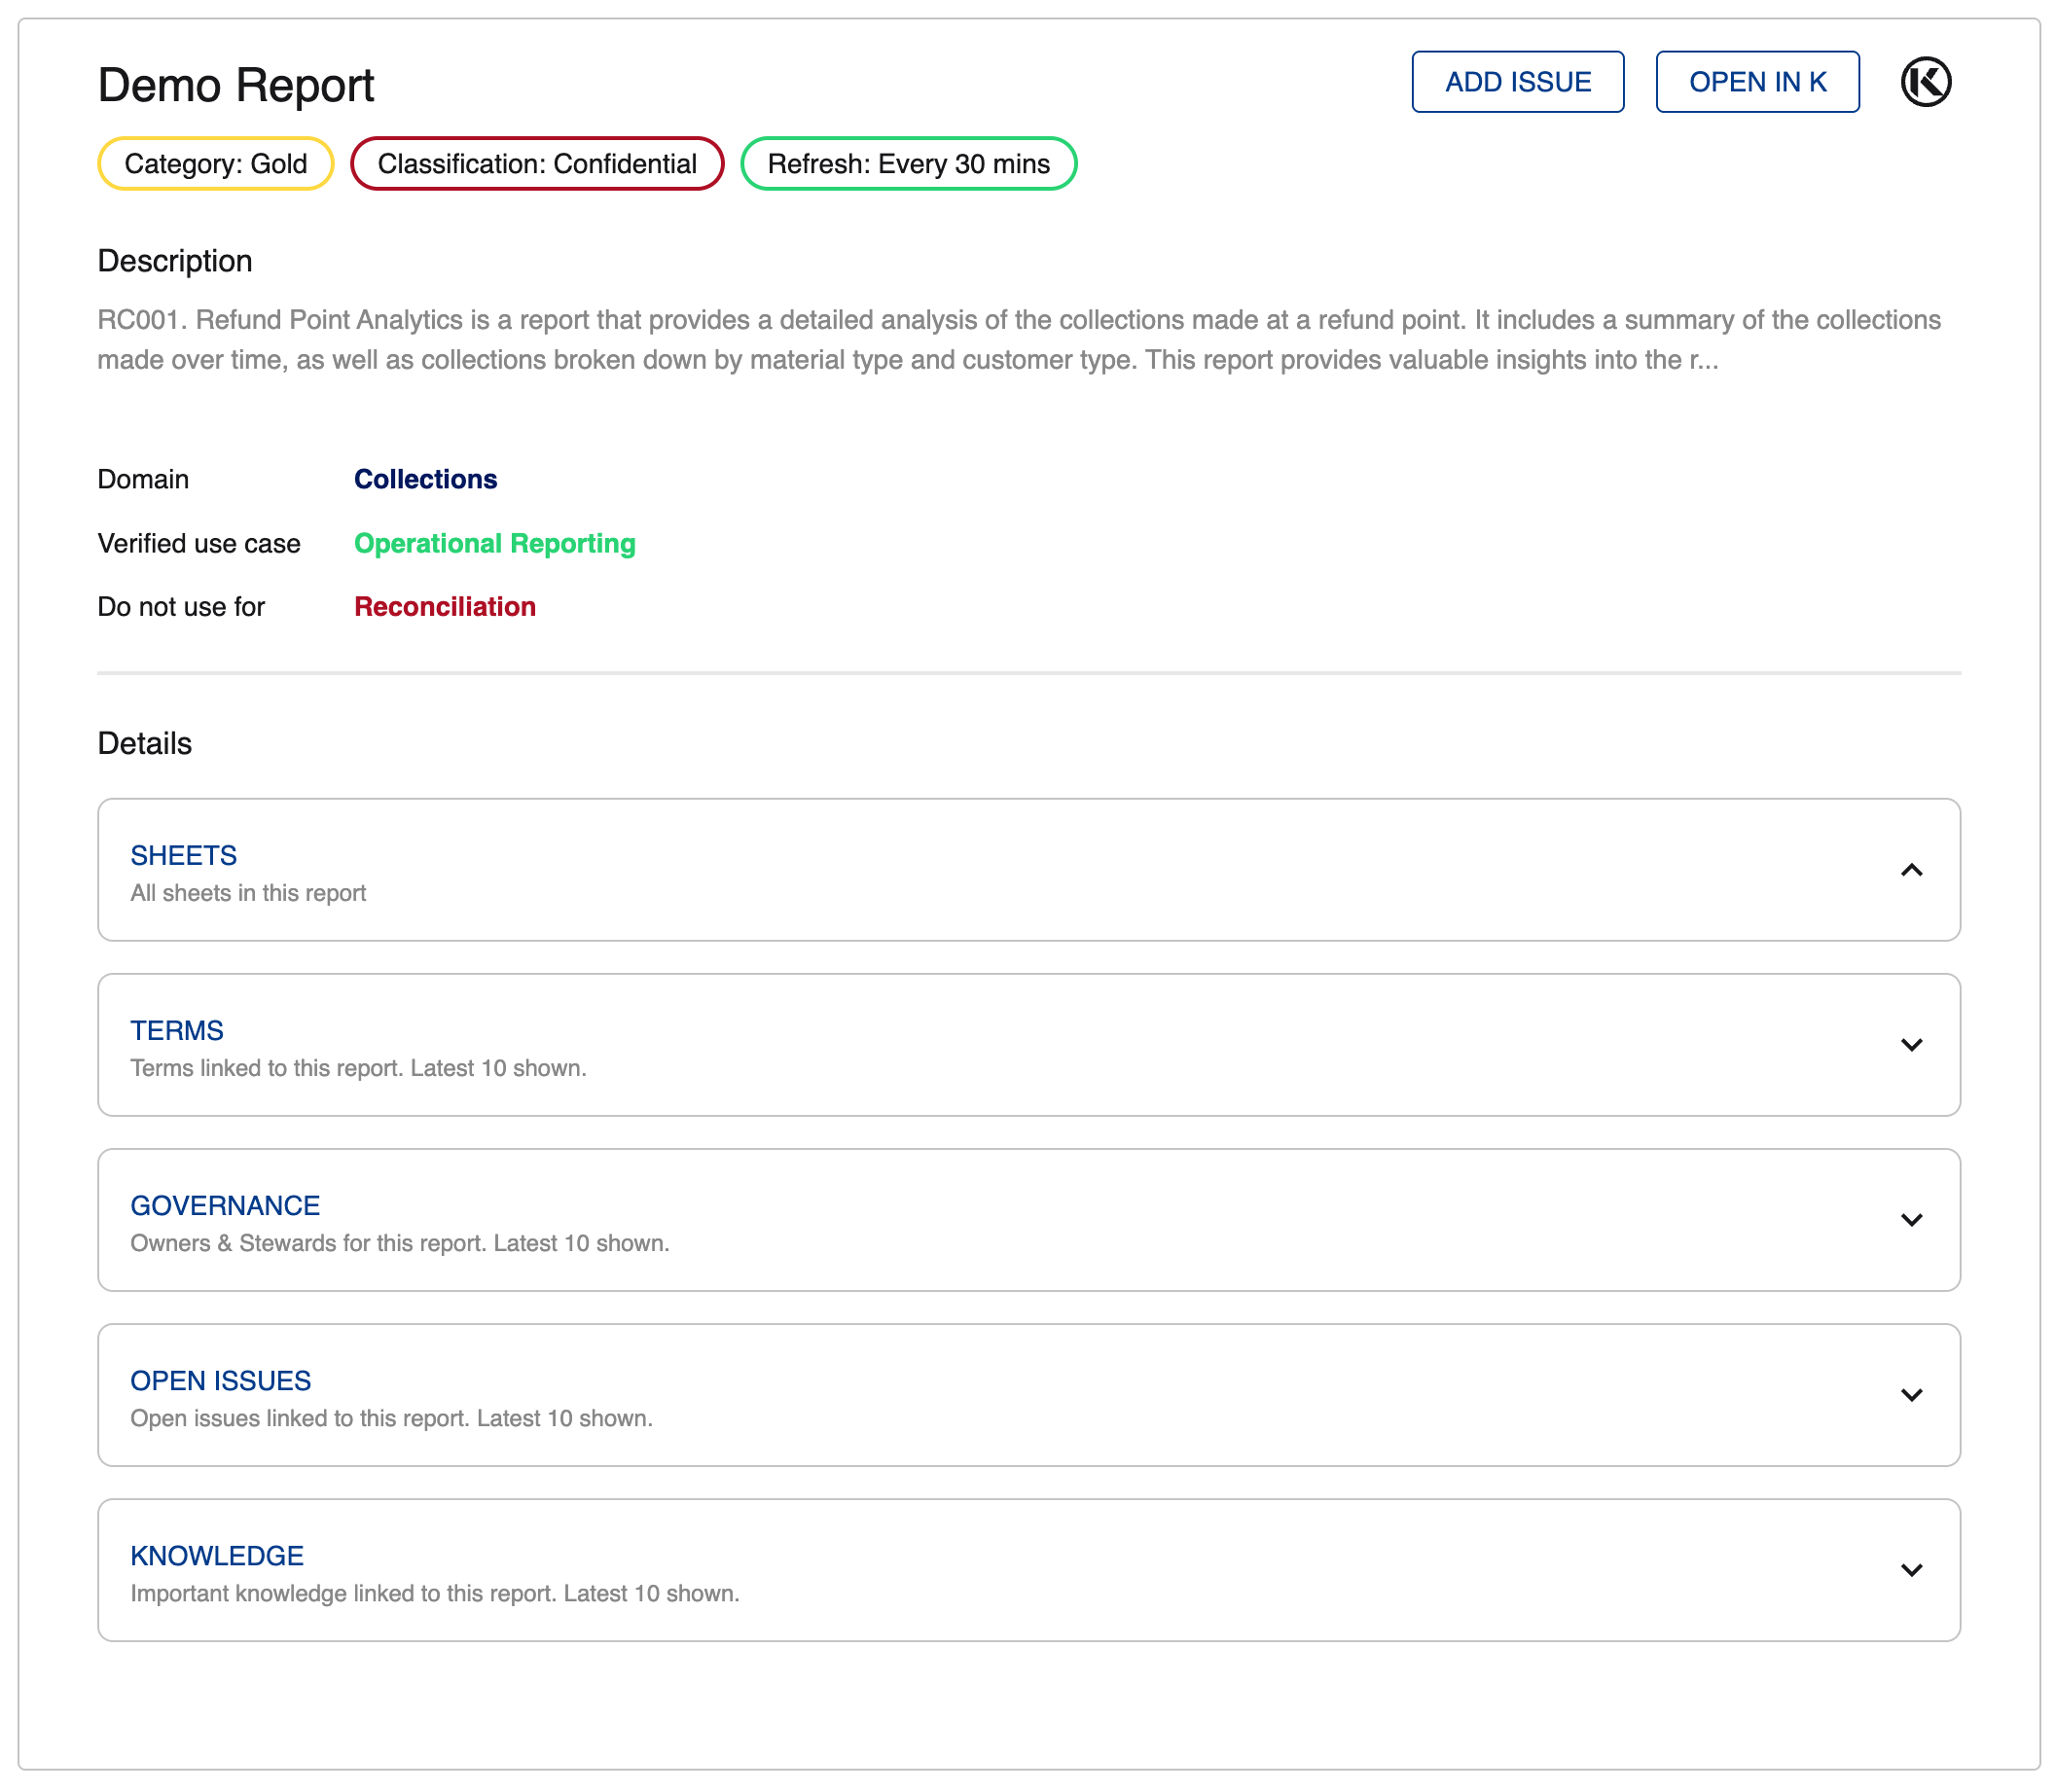
The detailed widget displays more information than the compact widget. This includes information such as the description, domain, use cases, channels etc. It also includes sections for
Sheets: List of sheets included in the report
Terms: List of terms linked to the report
Governance: List of owners and stewards linked to the report
Open issues: List of open issues linked to the report
Knowledge: List of knowledge assets linked to the report
The sections and the button to open the K profile in a new tab can be added/removed. See here for more information about customising the detailed widget.
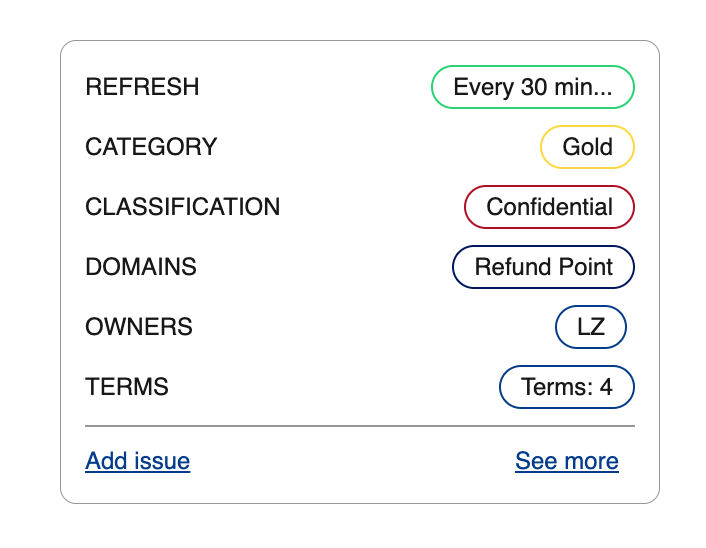
Compact: The compact embedding provides a condensed view of critical information for quick reference. The embedding includes details such as
Category
Classification
Domains
Owner
Refresh time
Terms
Use this option to present information such as category, owners and warnings at a glance. The profile requires a min width of 100px and a min height of 160px.
The compact widget adjusts its layout depending on the width provided. In a short space, it will adjust to a list format
In a wide space, it will adjust to a line format

Turning on embedding in the K platform
Available for Advance and Enterprise customers.
This step is for K Administrators only
Go to Platform Settings, Go to the Platform Management section and click Settings
Go to the Embedded Profiles options
Set Enable embedded profiles to True
Go to the CORS options.
Tool | Settings required |
|---|---|
Tableau | Edit Allow Web Origins. Enter the Domain of your BI tool and click Add |
Power BI | Set Disable Content Security Policy Header to True |
Customise the Detailed embedded widget
Go to Platform Settings, Go to the Platform Management section and click Settings
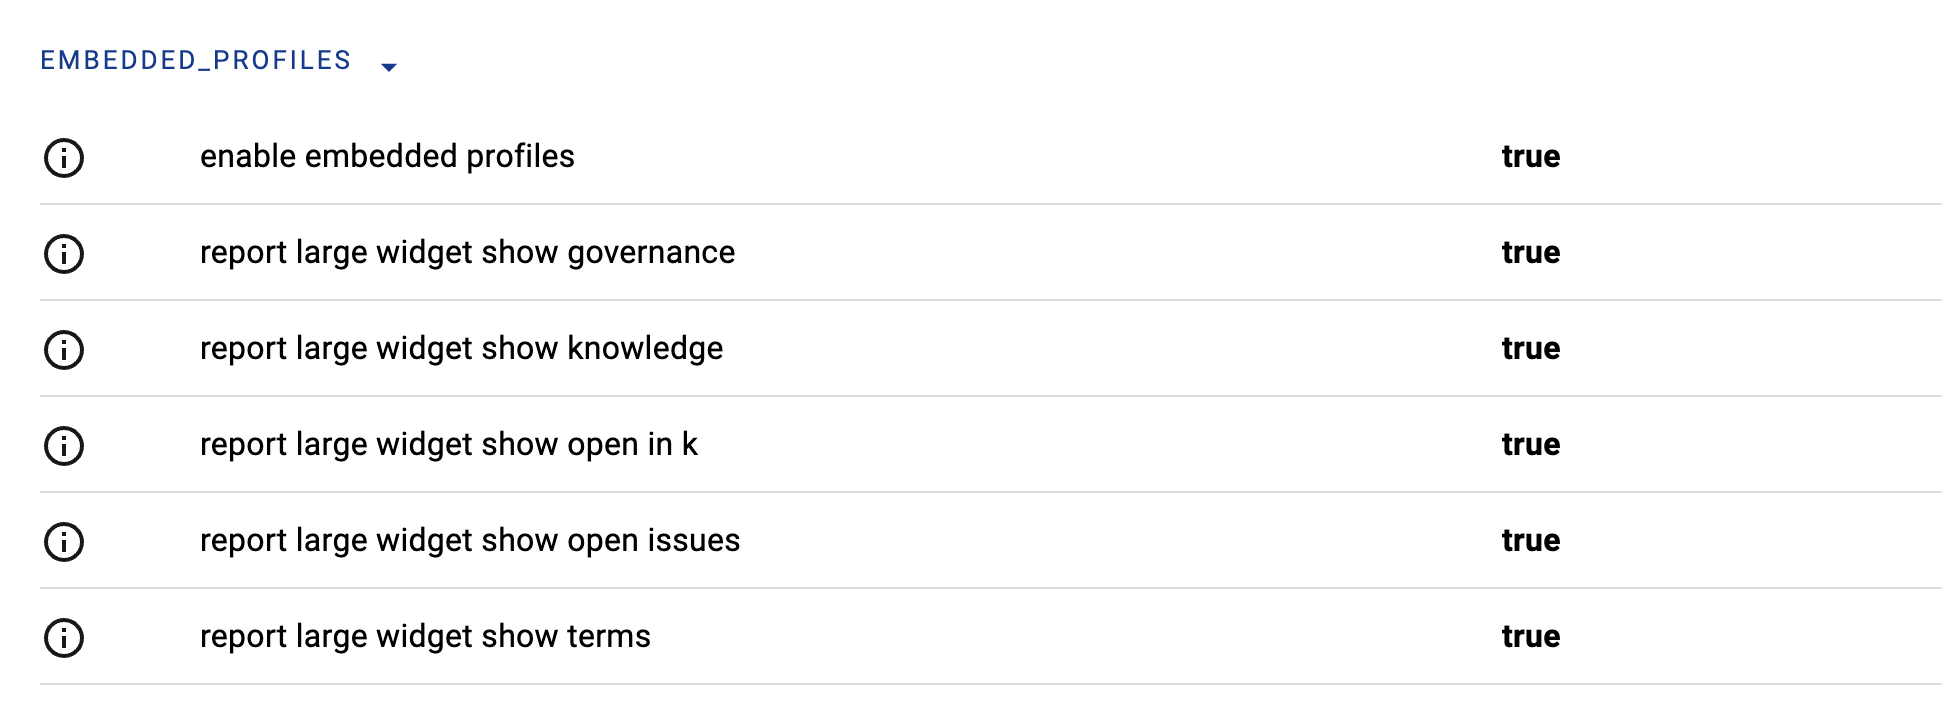
Go to the Embedded Profiles options. Adjust the options to customise the detailed embedded widget.
For example set report large widget show open issues to False to hide the Open issues section in the embedded
Configuring the Issue management workflow
When enabled, the Add issue button can be either:
Disabled
Redirect the user to the Add issue workflow in K (linked to the asset the Embedded profile is created for)
Redirect the user to another URL (e.g. Creating the issue in ServiceNow or Zendesk).
To configure the Add issue button
Go to Platform Settings, Go to the Platform Management section and click Settings
Go to the Embedded Profiles options.
Enable/Disable the Add issue button by setting the show issue button to True/False.
Note there are 2 settings, one for the compact embedding and one for the detailed embedding.Once you enable the Add issue button, you can adjust where the Add issue redirects to using the following options.

Set the Issue button target to URL and set the issue button URL to your external issue management tool.
Creating an embedded link
Go the profile page of a report you want to generate an embedding for.
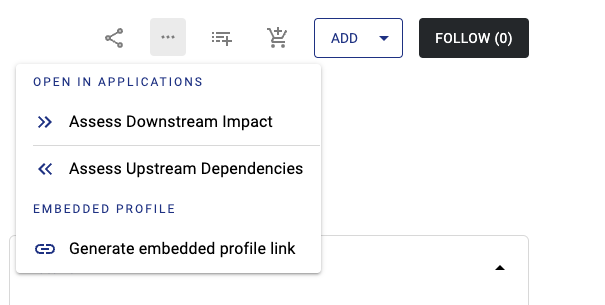
In the header, click on More Actions. Select Generate embedded profile link
Choose the right embedding code option that best suits your tool. See below for advice on which options are required for common BI tools
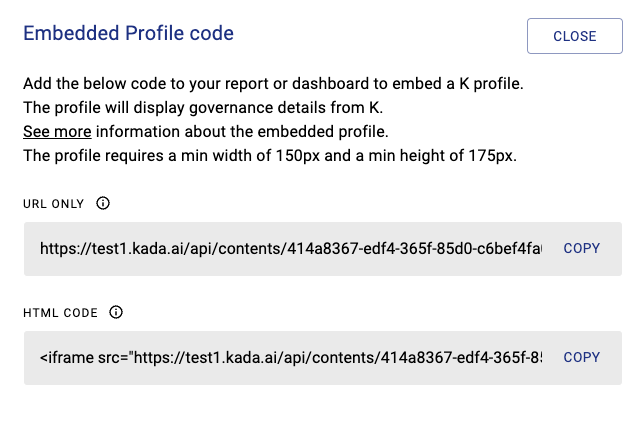
Tool | Embedding option |
|---|---|
Tableau / Tableau Cloud | URL only |
Power BI | HTML code |
Adding the embedding to your Report or Dashboard
In your BI tool editor, add an web page object (e.g. Tableau) or HTML viewer (e.g. Power BI)
Add the above code into the object to display the widget
