Data Ecosystem
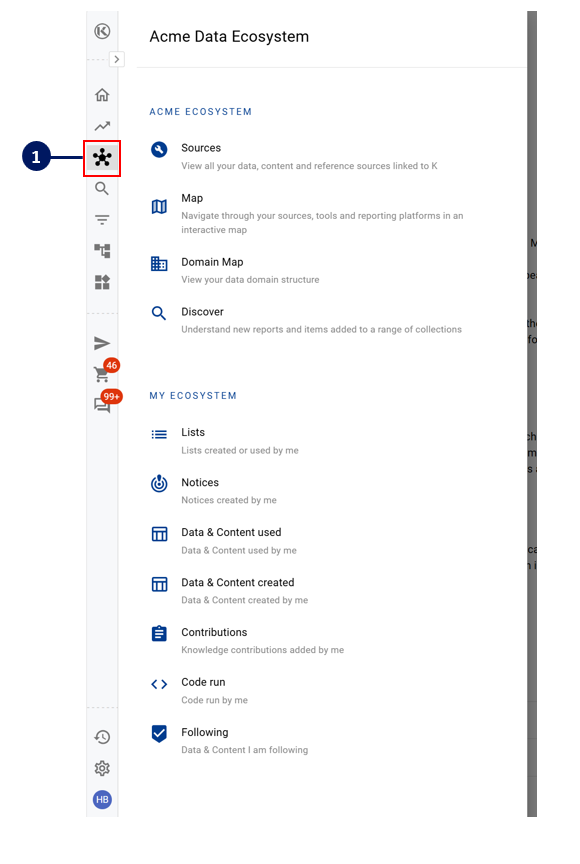
Your Data Ecosystem allows you to navigate and explore through your organisation’s complete data ecosystem.

Sources
The Sources page lets you view all Database and Source content that have been connected to K.

Map
The Map page lets you easily navigate through your ecosystem in a visual map and see how your database sources and content are connected, including which sources have data from a specific domain, or belong to a specific classification. This is particularly useful for showing Architects, Solution Designers and other users how the systems are connected.

Domain Map
The Domain Map page is a great way to help you understand how the Domain collection is structured, the hierarchy and which domains are child domains.

Discover
Use the Discover page to discover new items recently created in your data ecosystem. New items you can review include: Reports, Terms, Collections, Lists, Issues and Tags

My Ecosystem
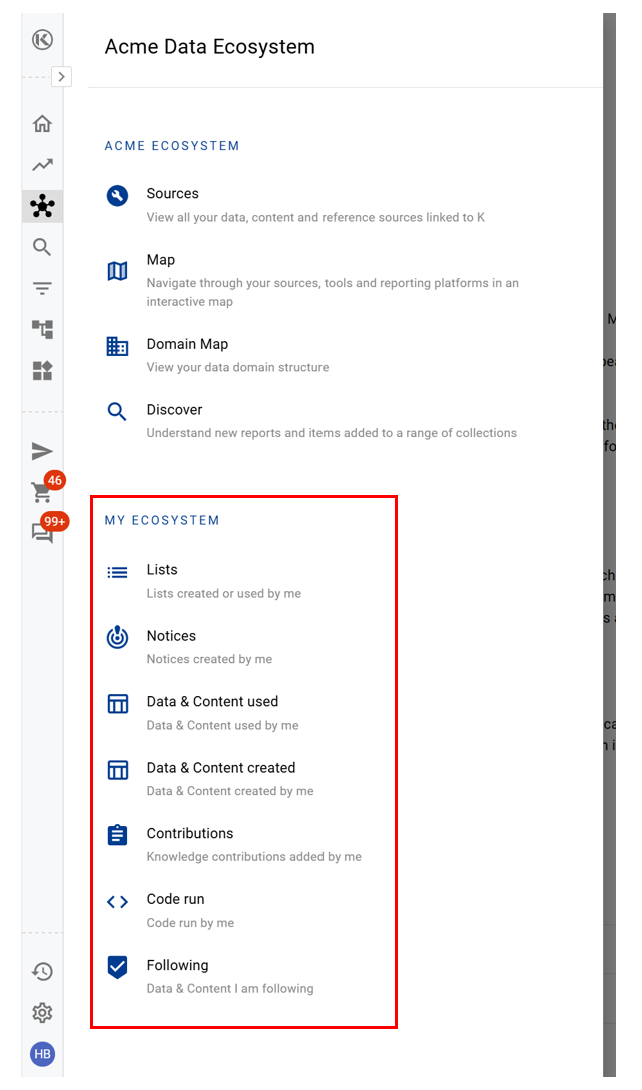
Under the My Ecosystem section you can access other pages specific to how you interact with the data ecosystem and K Platform.
Lists: Lists created or used by yourself
Notices: Warning notices created by yourself
Data & Content used: A page showing all the data and content you have used, displayed in chronological order
Data & Content created: A page showing all the data and content you have created, displayed in chronological order
Contributions: Contributions to documenting metadata and knowledge in the K platform.
Code run: Code that you have run, displayed in chronological order
Following: Data and content that you have chosen to follow in the K Platform

