Usage Tab
A key component of K is the ability to analyse usage over time. K categorises each asset it monitors based on how it is Used and Loaded.
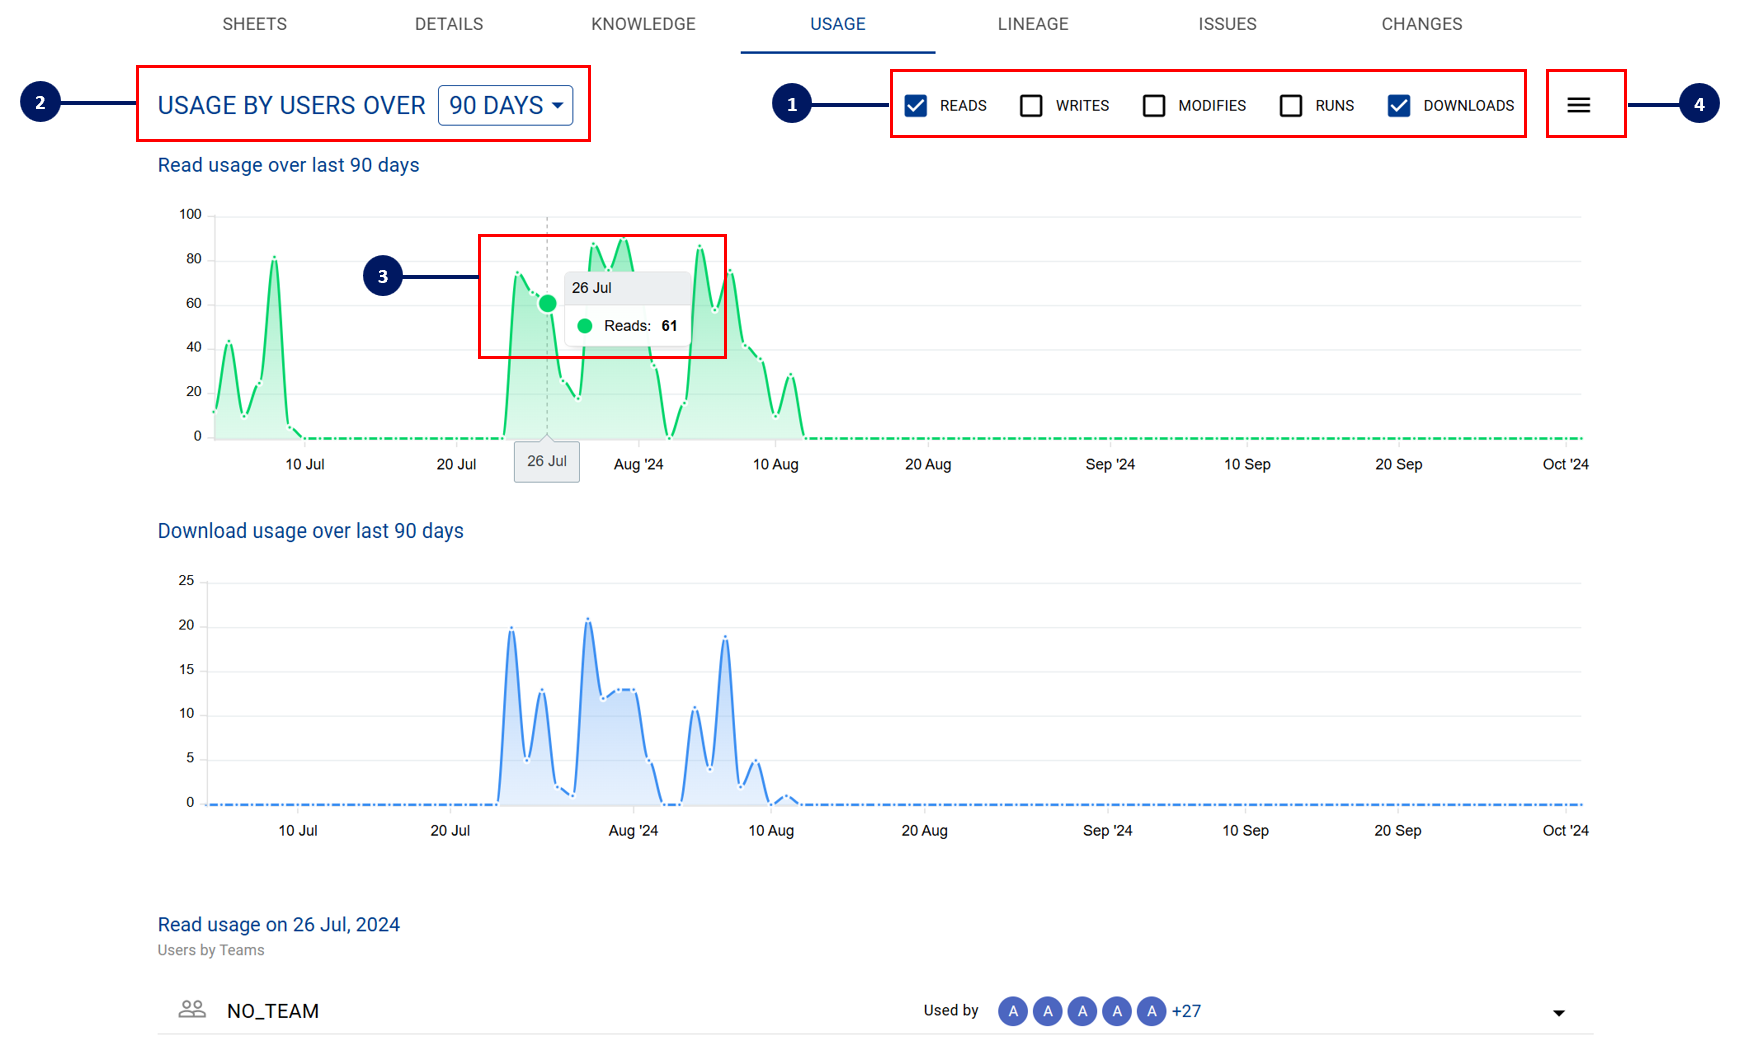
The Usage Tab is a great way to understand how a specific data asset is used over time.
Key features of the Usage Tab include the ability to:
Select the type of usage you want to view in a visual graph: Reads, Writes, Modifies, Runs and Downloads
Change the graph view to show either a unique count of users or content that have accessed the data asset over the specific time period
Drill down to see which specific users have used the data asset on a specific day. The list of users will be displayed underneath the graphs
Download the usage report in an excel format (available for Data Manager and Data Governance only)
Definitions of Usage Type
Usage Type | Definition | Example |
|---|---|---|
Reads | A user views or accesses the data asset and makes nil changes to the data asset | Runs a query against a table/column Downloads a report |
Writes | A user updates the data asset but does not make changes to the data assets strucure/meta | Dataset is refreshed Additional rows added to table Code: |
Modifies | The structure of the data asset or meta has changed | Report edited Dataset structure edited New column inserted in table |
Runs | Data object has successfully run a code | Pipeline finishes successfully Query executed |
Downloads | Data asset download has been detected from source event logs Note: Downloads will also be counted as a ‘Read’ usage as the user needs to access the data asset to enable download. | Report downloaded |
Usage is tracked by unique query signatures by user, by db_session, by hour interval. This allows K to consolidate high frequency usage such as single row inserts into a single event.
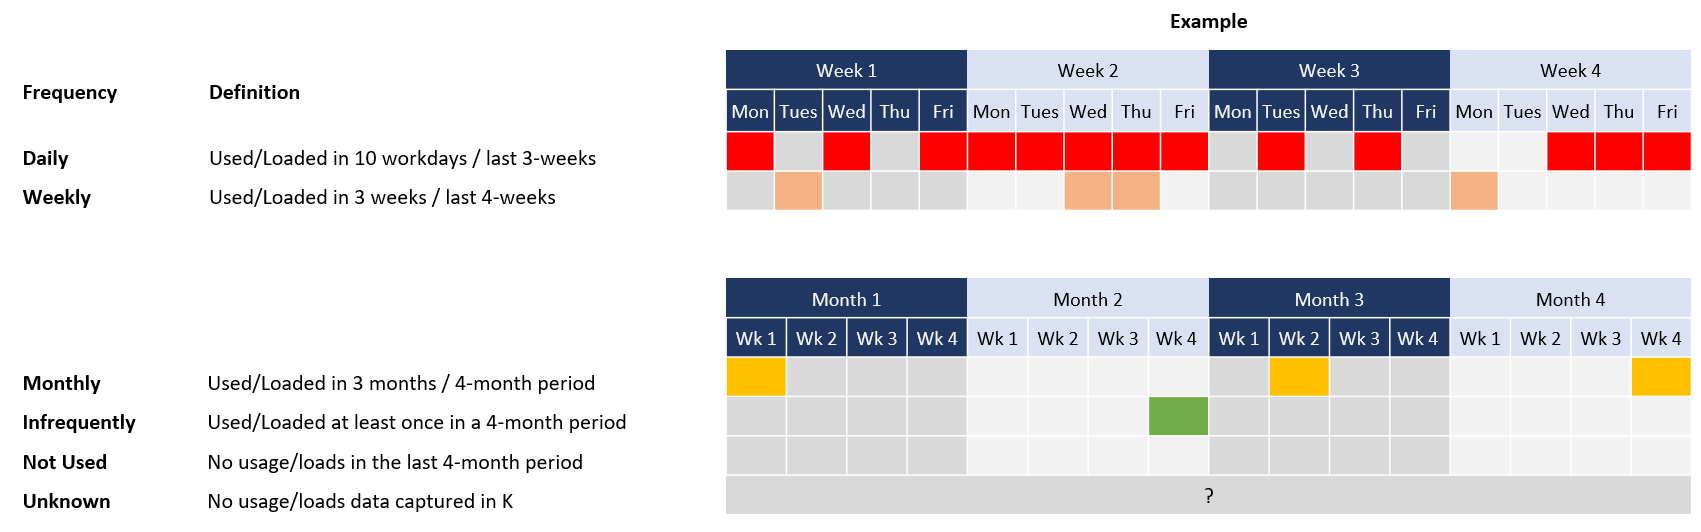
Definitions of Usage Frequency
The below definitions are the same definitions used for data loads.
Usage Frequency | Definition |
|---|---|
Daily | Used in 10 workdays / last 3-weeks |
Weekly | Used in 3 weeks / last 4-weeks |
Monthly | Used in 3 months / 4-month period |
Infrequently | Used at least once in a 4-month period |
Not Used | No usage in the last 4-month period |
Unknown | No usage data captured in K |
Usage or load frequency example: