Impact Assessment extracts & reports
There are several types of impact assessment reports and extracts that are available from the Impact Assessment application
Reports
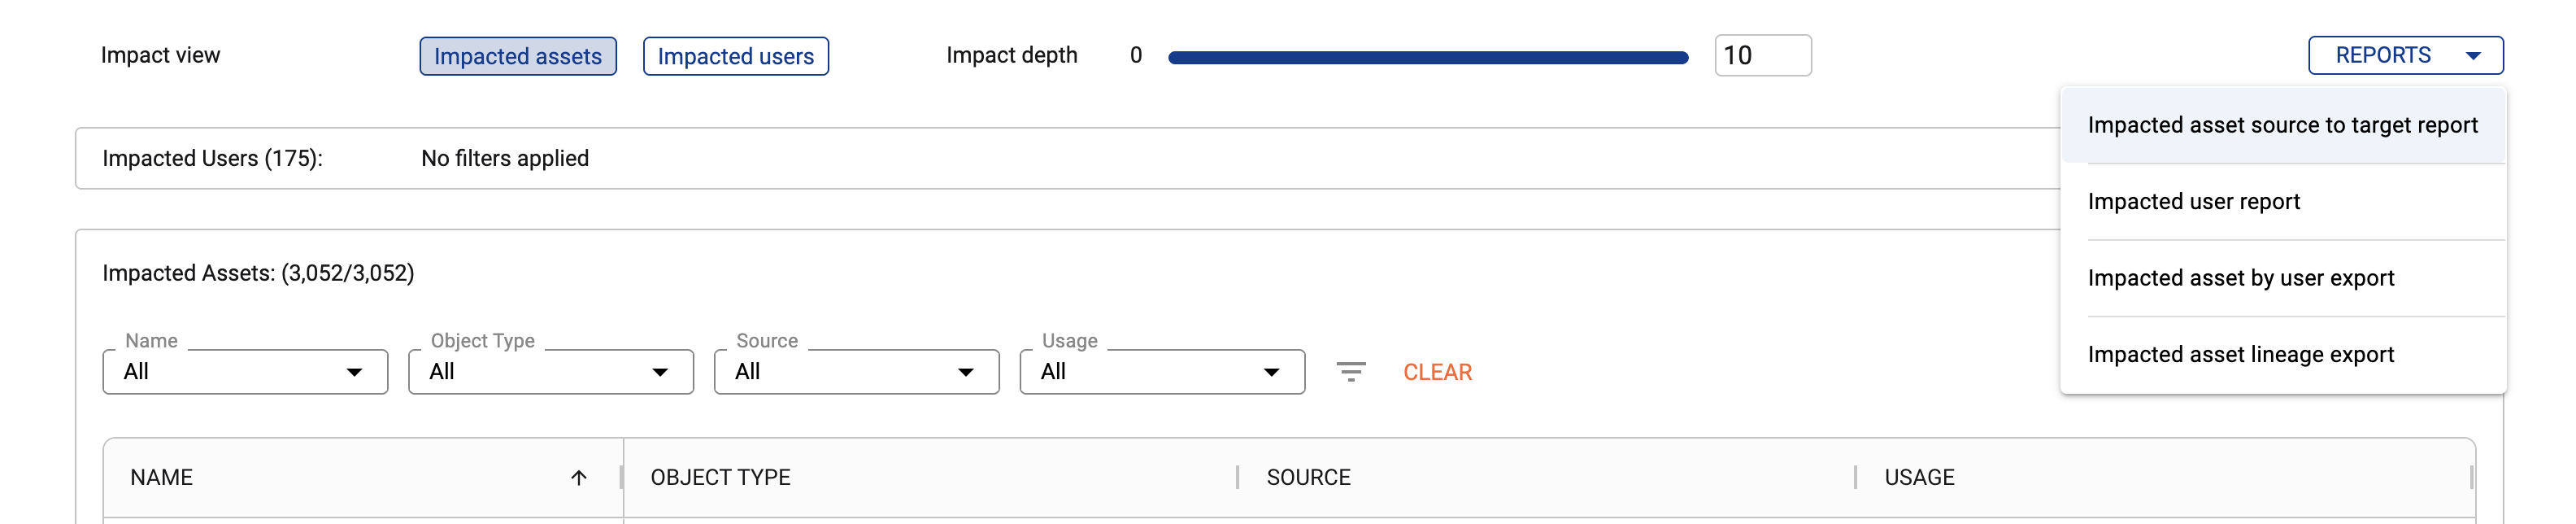
Impact assessment source to target report
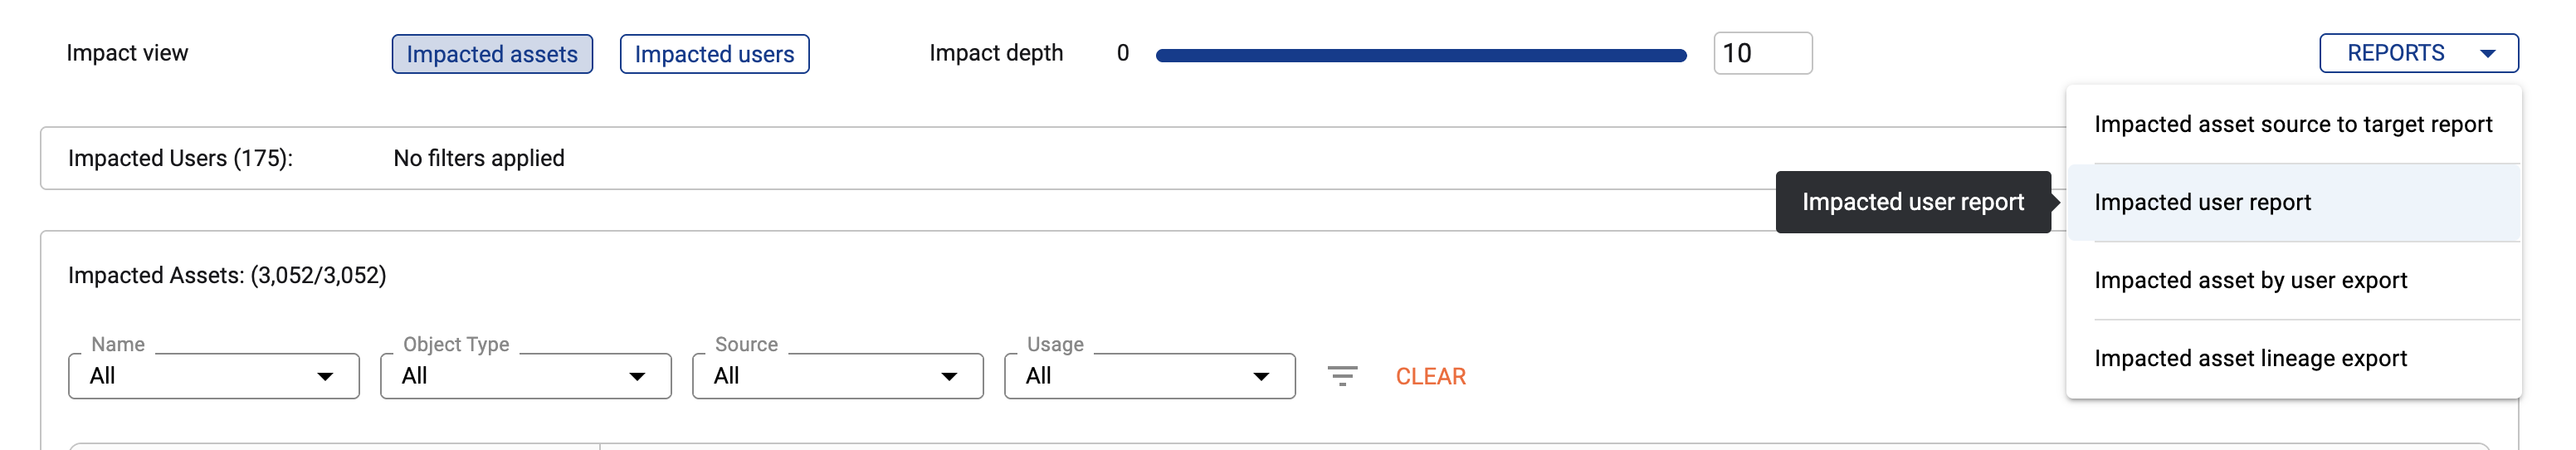
Impacted user report
Exports
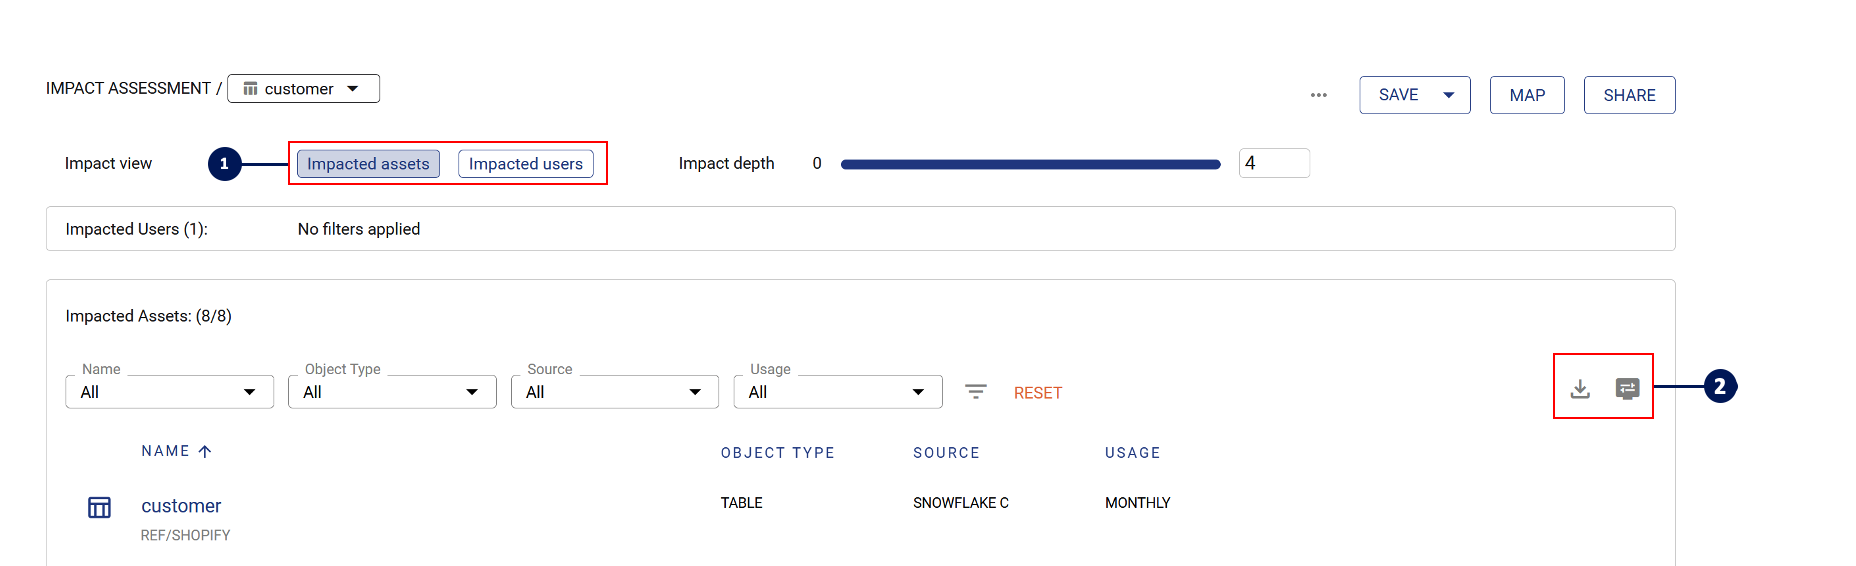
Impacted assets
Impacted users
Impacted asset by user export
Impacted asset lineage export
Reports
Impacted source to target report
The report provides a detailed source to target mapping of all the data flows identified in the impact assessment.
Available via the report button
The report typically includes the following information
Field | Description |
|---|---|
source_database_or_tool | source database / tool name |
source_schema_or_parent | source schema / parent name |
source_table_or_asset | source table / asset name |
source_column_or_field | source column / field name |
source_type | source type |
target_database_or_tool | target database / tool name |
target_schema_or_parent | target schema / parent name |
target_table_or_asset | target table / asset name |
target_column_or_field | target column / field name |
target_type | target type |
impacted_table_or_asset_last_accessed_date | last time the target asset was accessed |
impacted_table_or_asset_is_temporary | if the target asset is a temporary asset (hidden flag = Yes) |
depth | min depth from the asset |
For a large impact assessment, this report may take some time to download. Do not CLOSE the tab until the report has downloaded.
Impacted user report
The report provides a detailed target to user report outlining all the user details for each impacted asset.
Available via the report button
The report typically includes the following information
Field | Description |
|---|---|
database_or_tool | database / tool name |
schema_or_parent | schema / parent name |
asset_type | type |
table_or_asset | table / asset name |
column_or_field | column / field name |
impacted_user | user display name |
impacted_user_team | user team |
impacted_user_behaviour | user behaviour on the asset (Read, Write, ReadWrite) |
impacted_user_name | user name |
impacted_user_job_type | user job type |
table_or_asset_last_accessed_date | user last accessed date on the aseet |
depth | asset depth |
For a large impact assessment, this report may take some time to download. Do not CLOSE the tab until the report has downloaded.
Exports
Impacted assets export
Available on the impacted asset tab.
Select the download button to download the results
Note: The download is based on the filters and columns added to the tab. Add more columns to the table to include it in the download.
Impacted users export
Similar to impacted users, select the impacted users tab and click on the download button to downloaded the impacted users
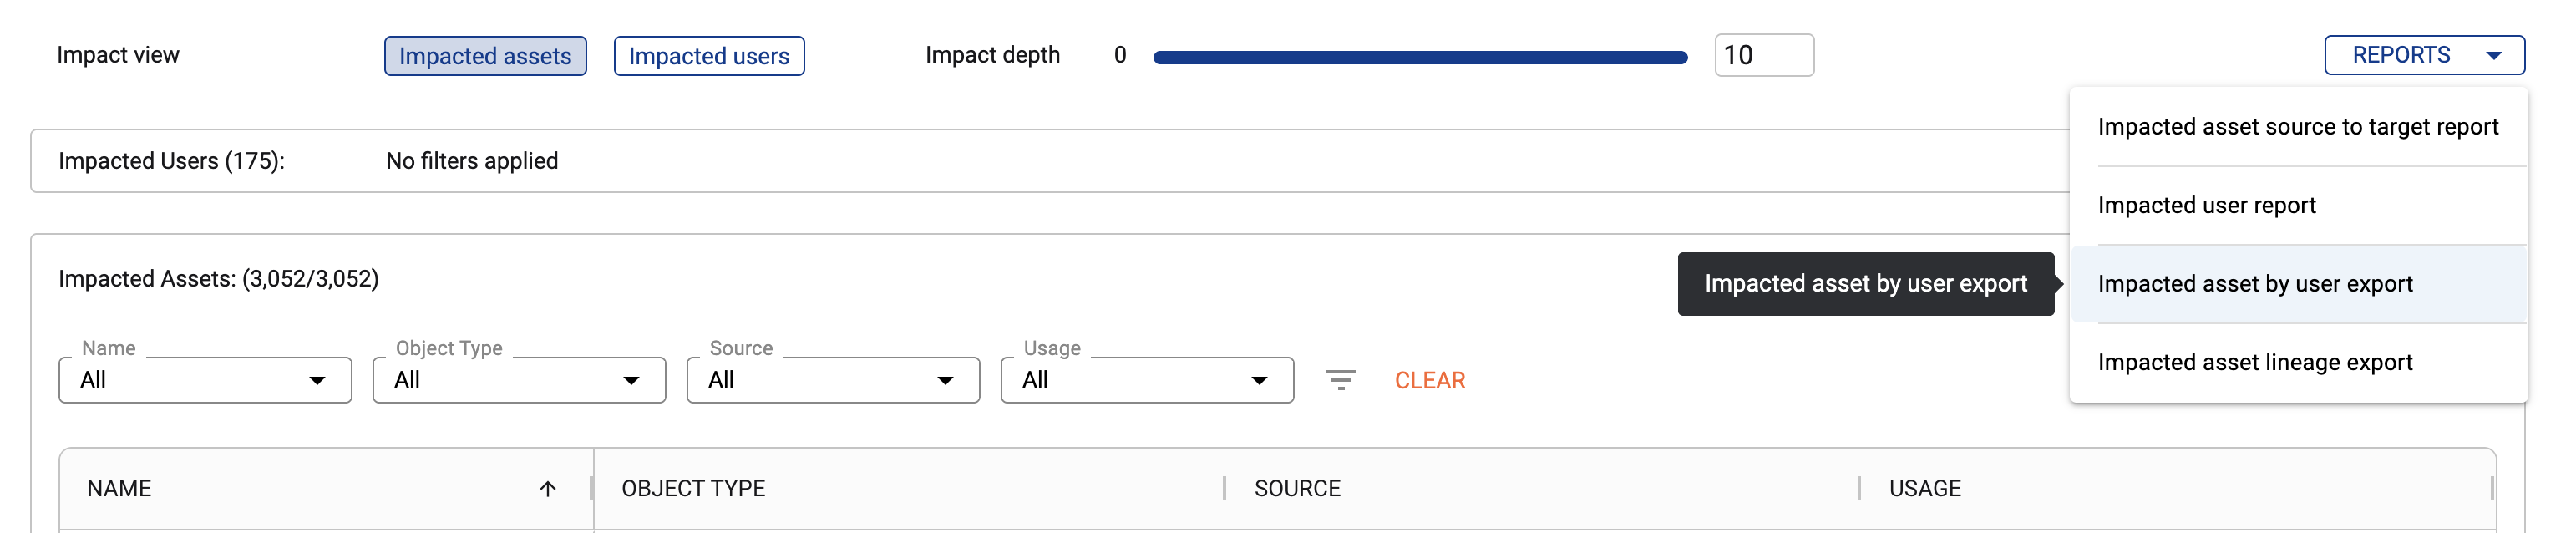
Impacted asset by user export
This export provides a JSON structured file that includes all users of an impacted asset.
See below instructions for how to flatten this JSON file using Excel
Available via the report button
Use this export to join to a customised Impacted asset export and Impacted user export to create a custom impacted user report
Impacted asset lineage export
This export provides the source and target ID between each asset in the impact assessment.
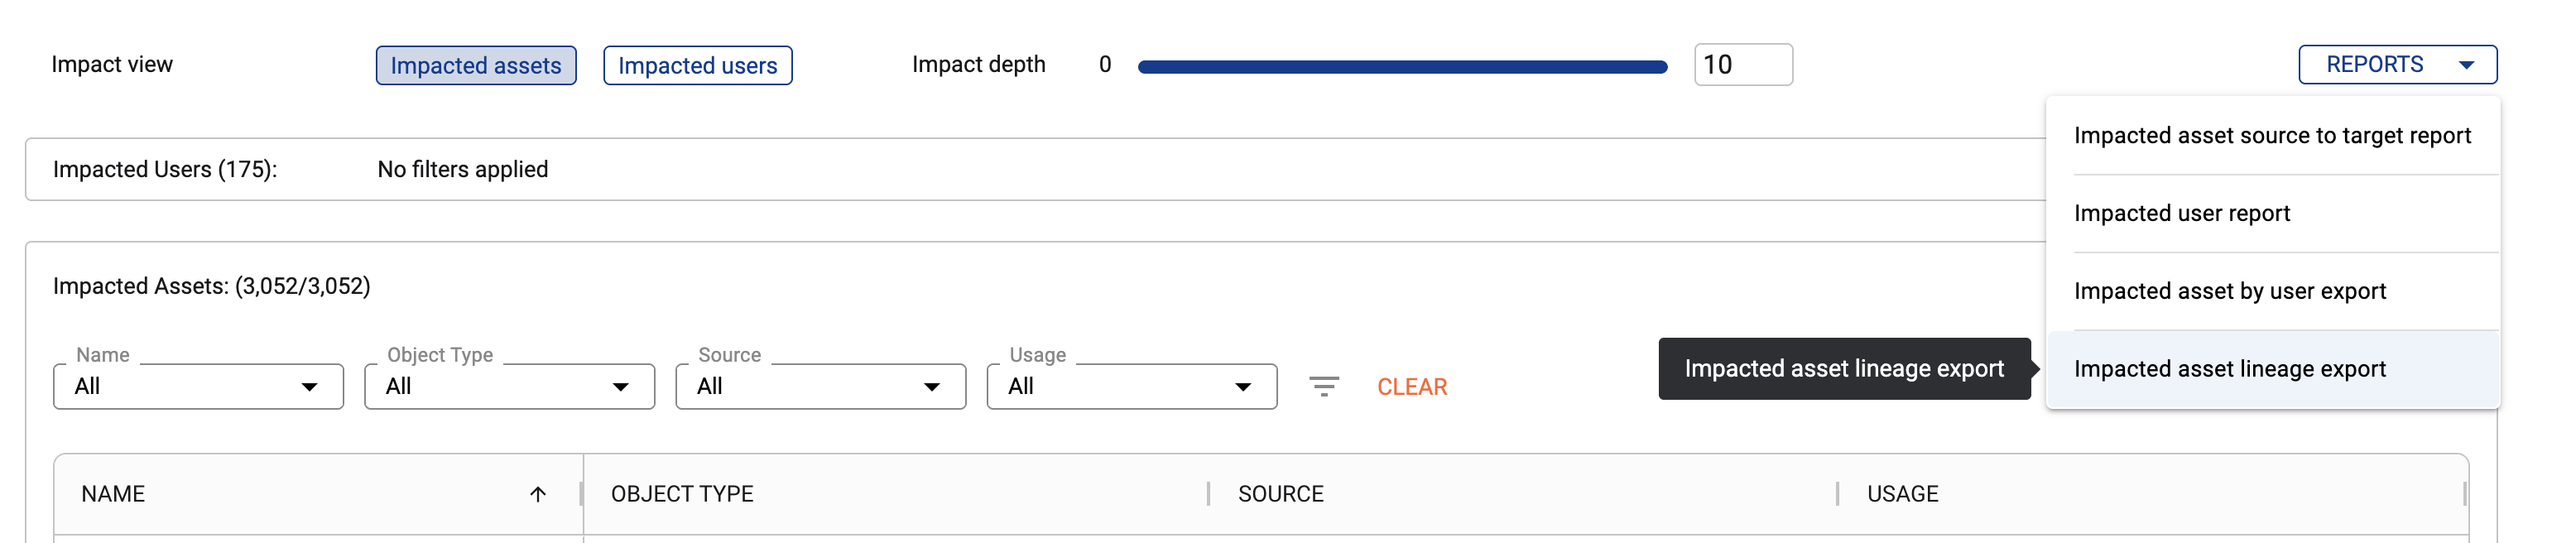
Use this export to join to a customised Impacted asset export to create a custom source to target mapping report.
Appendix: Flattening JSON using Excel
Step 1) Load the JSON into Power Query
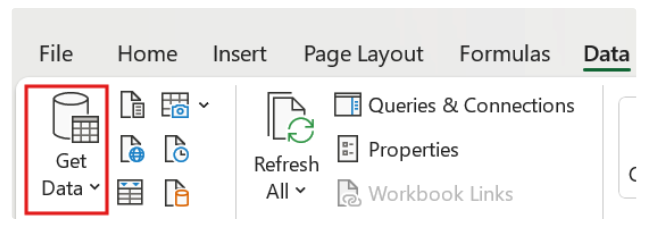
Open Excel. Click on the Data tab.
Click Get Data → From File → From JSON.
Select your .json file downloaded from Impact Assessment extracts & reports | Impacted-asset-by-user
Power Query will load and display the hierarchical JSON structure.
Step 2) Inspect the Structure
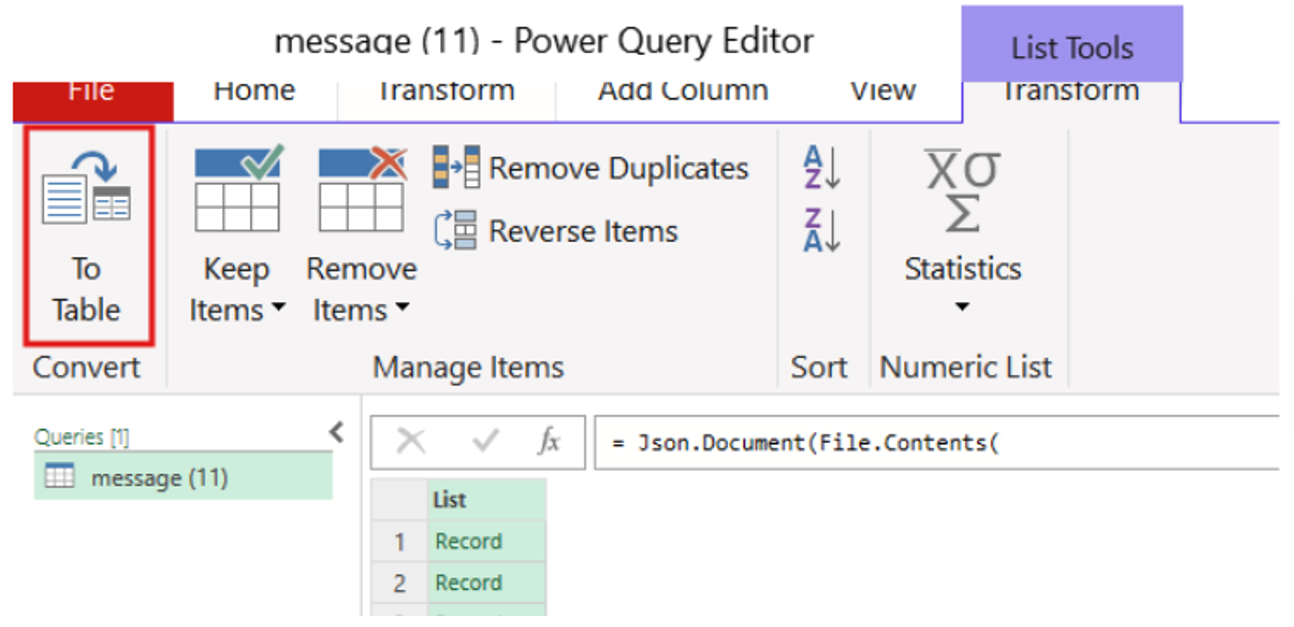
Power Query shows the JSON data in a nested format. You might see columns containing: Records (for nested objects) and Tables (for nested arrays)
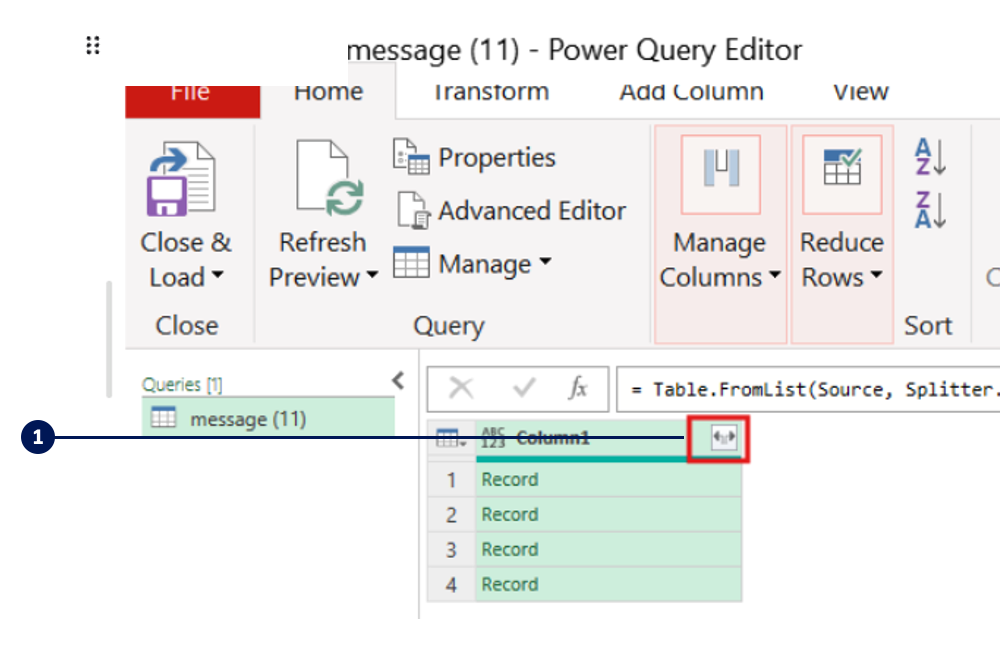
Go to the Transform Tab. Click on Convert to Table
You’ll need to expand these to flatten the data.
Step 3) Expand Nested Records
You’ll need to expand these to flatten the data within the nesting.
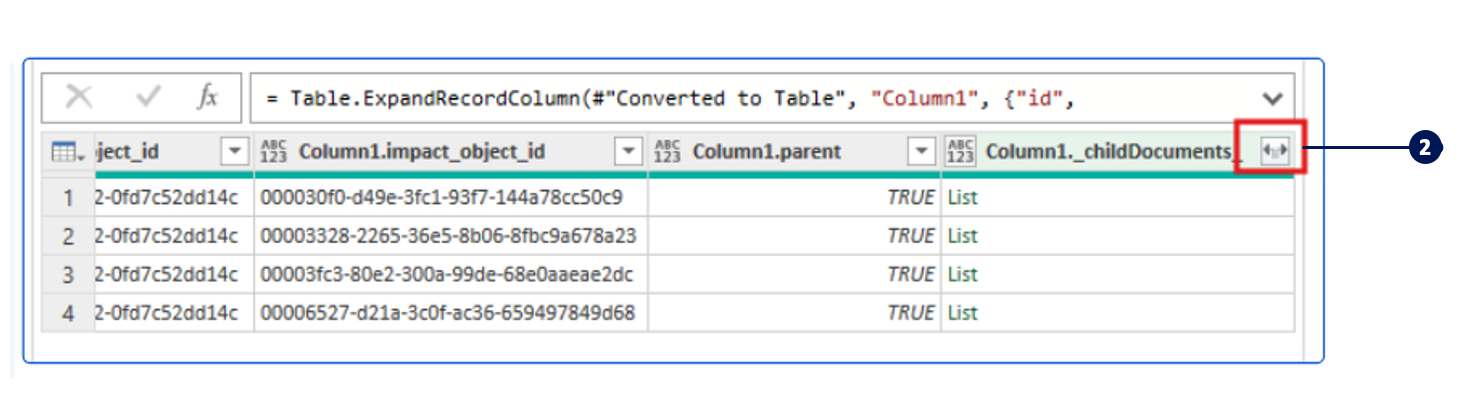
Click the small expand icon next to the column containing a Record.
Select the fields you want to extract to a row.
Click OK.
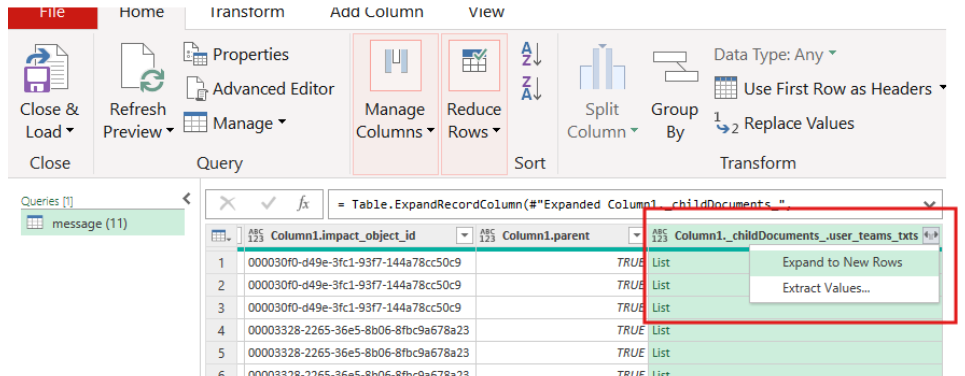
Repeat the above step if the newly expanded fields still contain nested records.
Example
Before
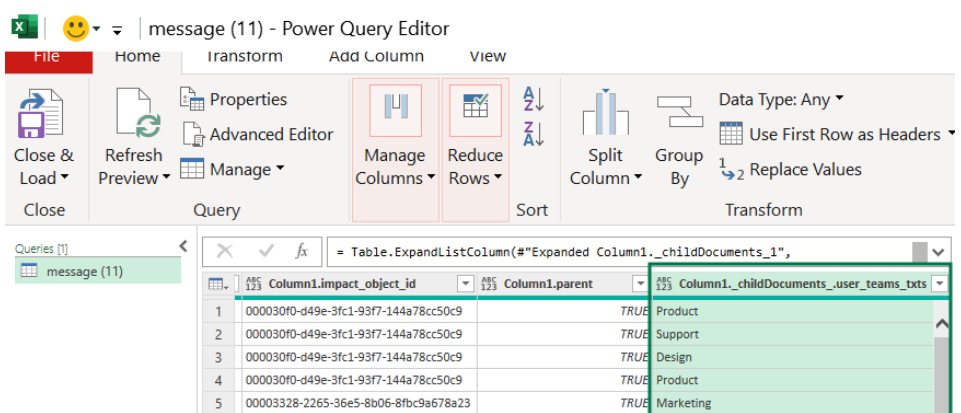
After
Step 4) Remove/Filter Unnecessary Columns
Once flattened, delete any redundant columns to clean up your dataset.
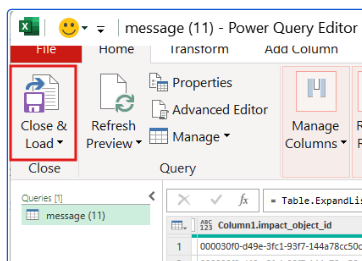
Step 5) Load to Excel
When you're done, click Close & Load to bring the data into your Excel sheet