Impact Assessment
K can help you automatically conduct impact assessments to assess the impact of changes to data items and identify impacted users. Common scenarios where an impact assessment would be helpful include:
Checking which data assets and users are impacted by a potential change.
Assessing the testing effort required for a change.
Quickly verifying which data assets have been impacted by an incident/issue
Generating a list of users, data owners or stewards of impacted data assets to contact
Data migration analysis
The updated IA does not currently have the ability to send impact notices. This feature will be added within the next few months. If this feature is required, you can toggle to the original IA.
About the K Impact Assessment
The K impact assessment can be performed in different ways:
Direction: Relative to the data asset, the direction you want to assess impact across the data lineage e.g. Upstream vs Downstream
Assessment level: At what data level do you want to conduct the impact assessment. Based on the type of data asset selected there are 4 types of assessment levels
Assessment level | Included in Assessment score | Description |
|---|---|---|
Table level | Coarse grain assets: Tables, Dataset Tables. Reports, Pipelines and ML Models | Performs a coarse grain assessment and returns all impacted assets that are either: Tables, Dataset tables, Reports, Data pipeline, or ML models |
Column level | Fine grain assets: Column, Fields, Sheets | Performs a fine grain assessment and returns all impacted assets that are either: Columns, Dataset fields and Sheets |
Users | Performs a user assessment and returns all data assets that a specific user has created or used | |
Coarse grain assets within a collection instance: Tables, Dataset Tables, Reports, Pipelines and ML Models | Performs a collection assessment and returns all Table Level data assets (i.e. Tables, Dataset tables, Reports, Data pipeline, or ML models) that are within the collection |
How to run an impact assessment
To perform an impact assessment, you first need to identify the impact assessment target. After confirming the impact assessment target, you can then choose the assessment direction and level.
Step 1) Select impact assessment target
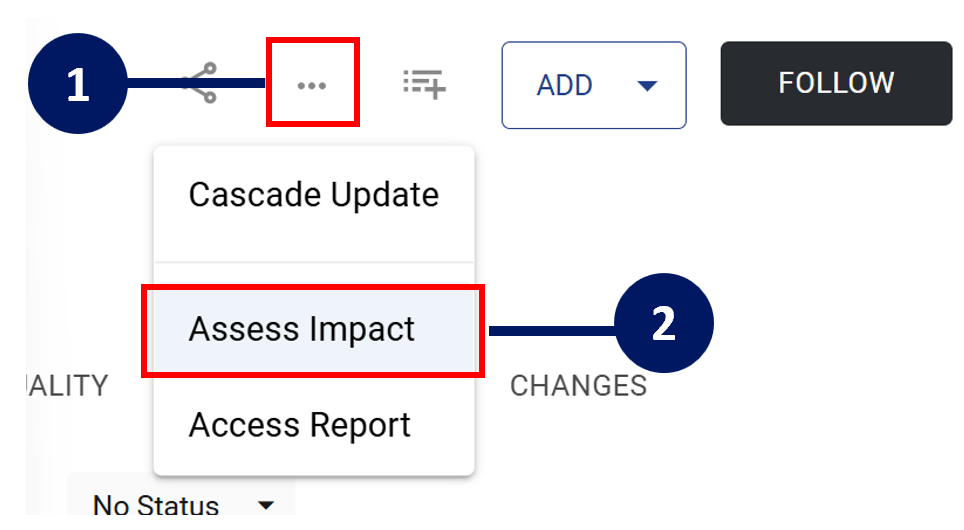
To select an individual data asset, go to the Data Profile page and in the header click on '…' to access more options and select Assess Impact
To select multiple data assets and conduct a multi-asset impact assessment:
Create a list that contains all of the assets you want to conduct the impact assessment
Select a collection instance that contains all of the assets you want to conduct the impact assessment on
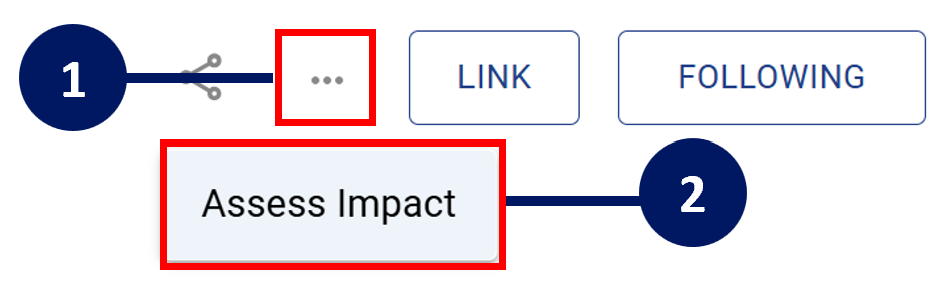
Open the data list and create an in the header click on '…' to access more options and select Assess Impact
Step 2) Configure impact assessment settings
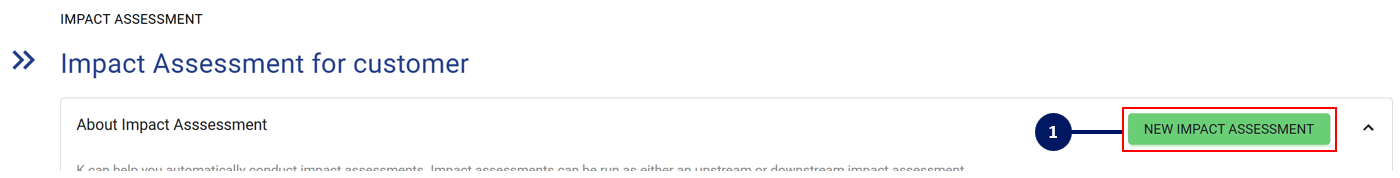
Click on the green ‘New Impact Assessment’ button
Note: If the button is greyed out, it means the impact assessment target has not been confirmed i.e. in the below screenshot, impact assessment target is ‘customer’
Confirm the impact assessment settings and click Next
Assessment Level: Table, Column, User, or Collection Bounded
Note: This is a dynamic field and the options will change depending on the type of data you have selected i.e. if you have selected a Table to assess, then only the Table assessment level option will appear
Direction: Upstream or Downstream
Confirm the next level of assessment detail and click Run
Depth limit
For large impact assessments, we recommend setting a lower depth limit as an initial trial and then re-running the assessment with a higher depth if required
Expansion limit
For each impacted data asset node, the number of downstream or upstream data connections to be displayed. Connecting data asset nodes will be displayed based on trust ranking (i.e. If the limit is 20 and there are 21 impacted data assets, then the least trusted data asset node will be hidden)
Usage period
Source limits (optional field)
Step 3) Check and access your impact assessment results
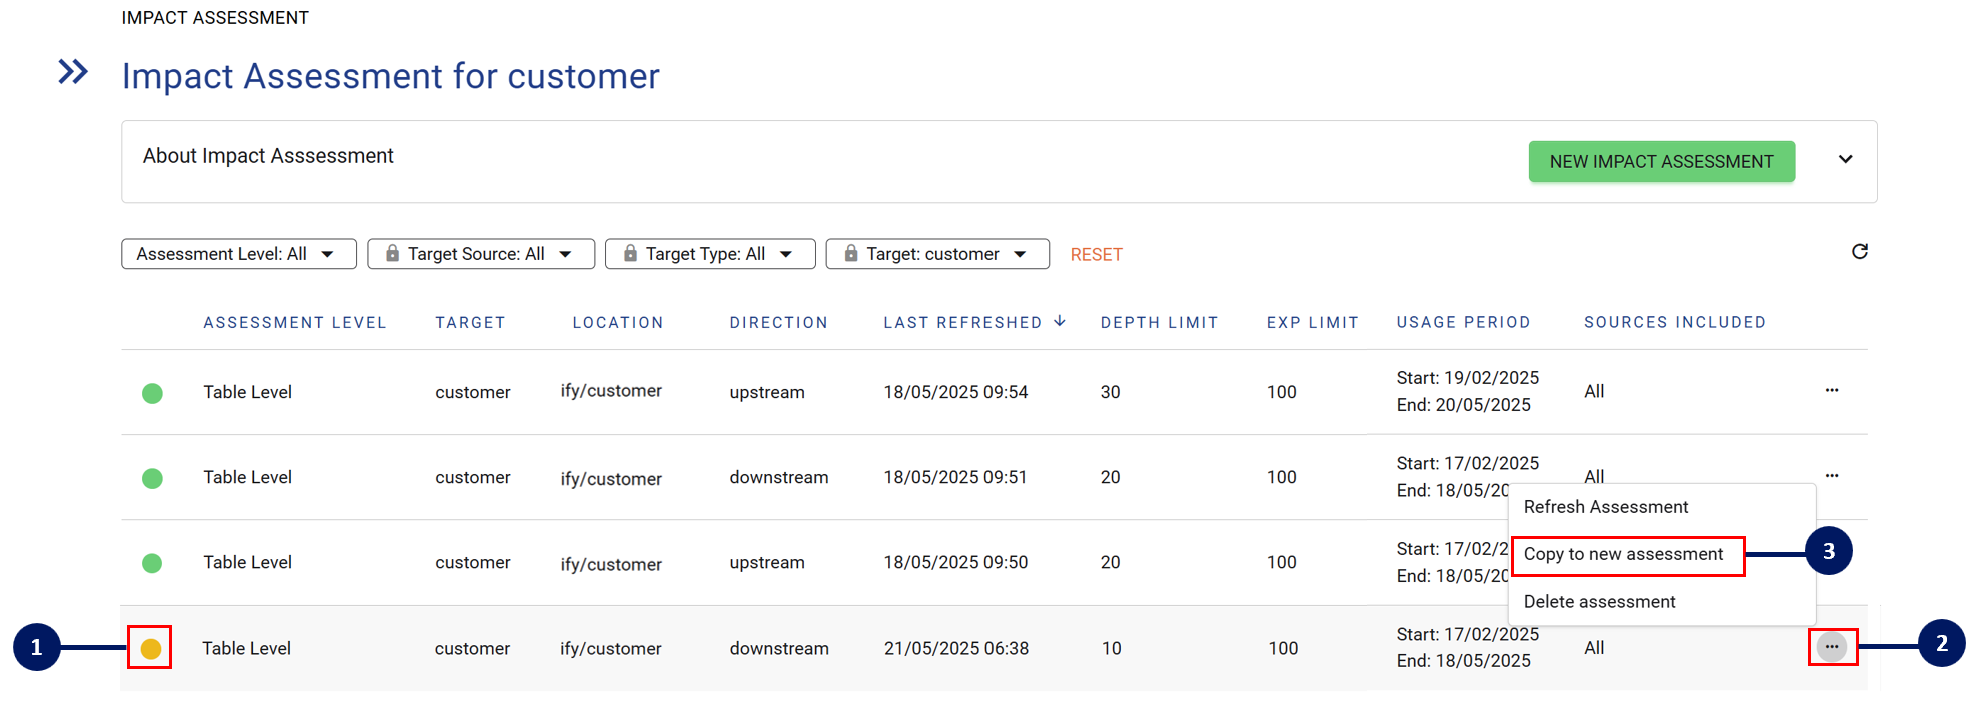
While your impact assessment is running, the status will display as Amber. Once an impact assessment is ready to review, the status will turn to Green
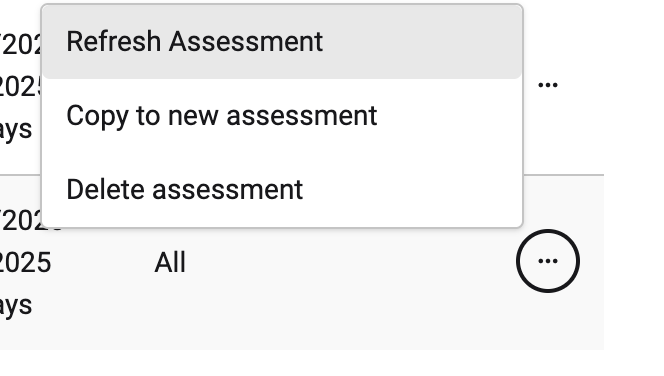
On this screen, you can quickly view the impact assessment settings. If you notice anything is incorrect, you can click on the '…' icon and click on Copy to new assessment to tweak the assessment and quickly re-run it
If you change and impact assessment settings, a new result will be displayed in a new row.
If you choose to Refresh an impact assessment, then the impact assessment results will be over-ridden with the latest impact assessment results.
Note: A refresh uses the exact same assessment settings (including the usage assessment period). This may be helpful if you have loaded additional data or new sources and want to refresh the impact assessment
If you want to re-run the assessment across a more recent time period, you will need to click Copy to new assessment and update the usage assessment date
To access your impact assessment, click on the row
All users can view previously run impact assessments
If you run a historical impact assessment (e.g. 90day window for last year), the impact assessment will be based on the data lineage of the ecosystem that K has stored as at last year. This means if you have in the last year onboarded additional data sources, the historical impact assessment will not show these results as K has not stored the metadata.
Viewing impact assessment results
The default impact assessment view shows the results in a list format.
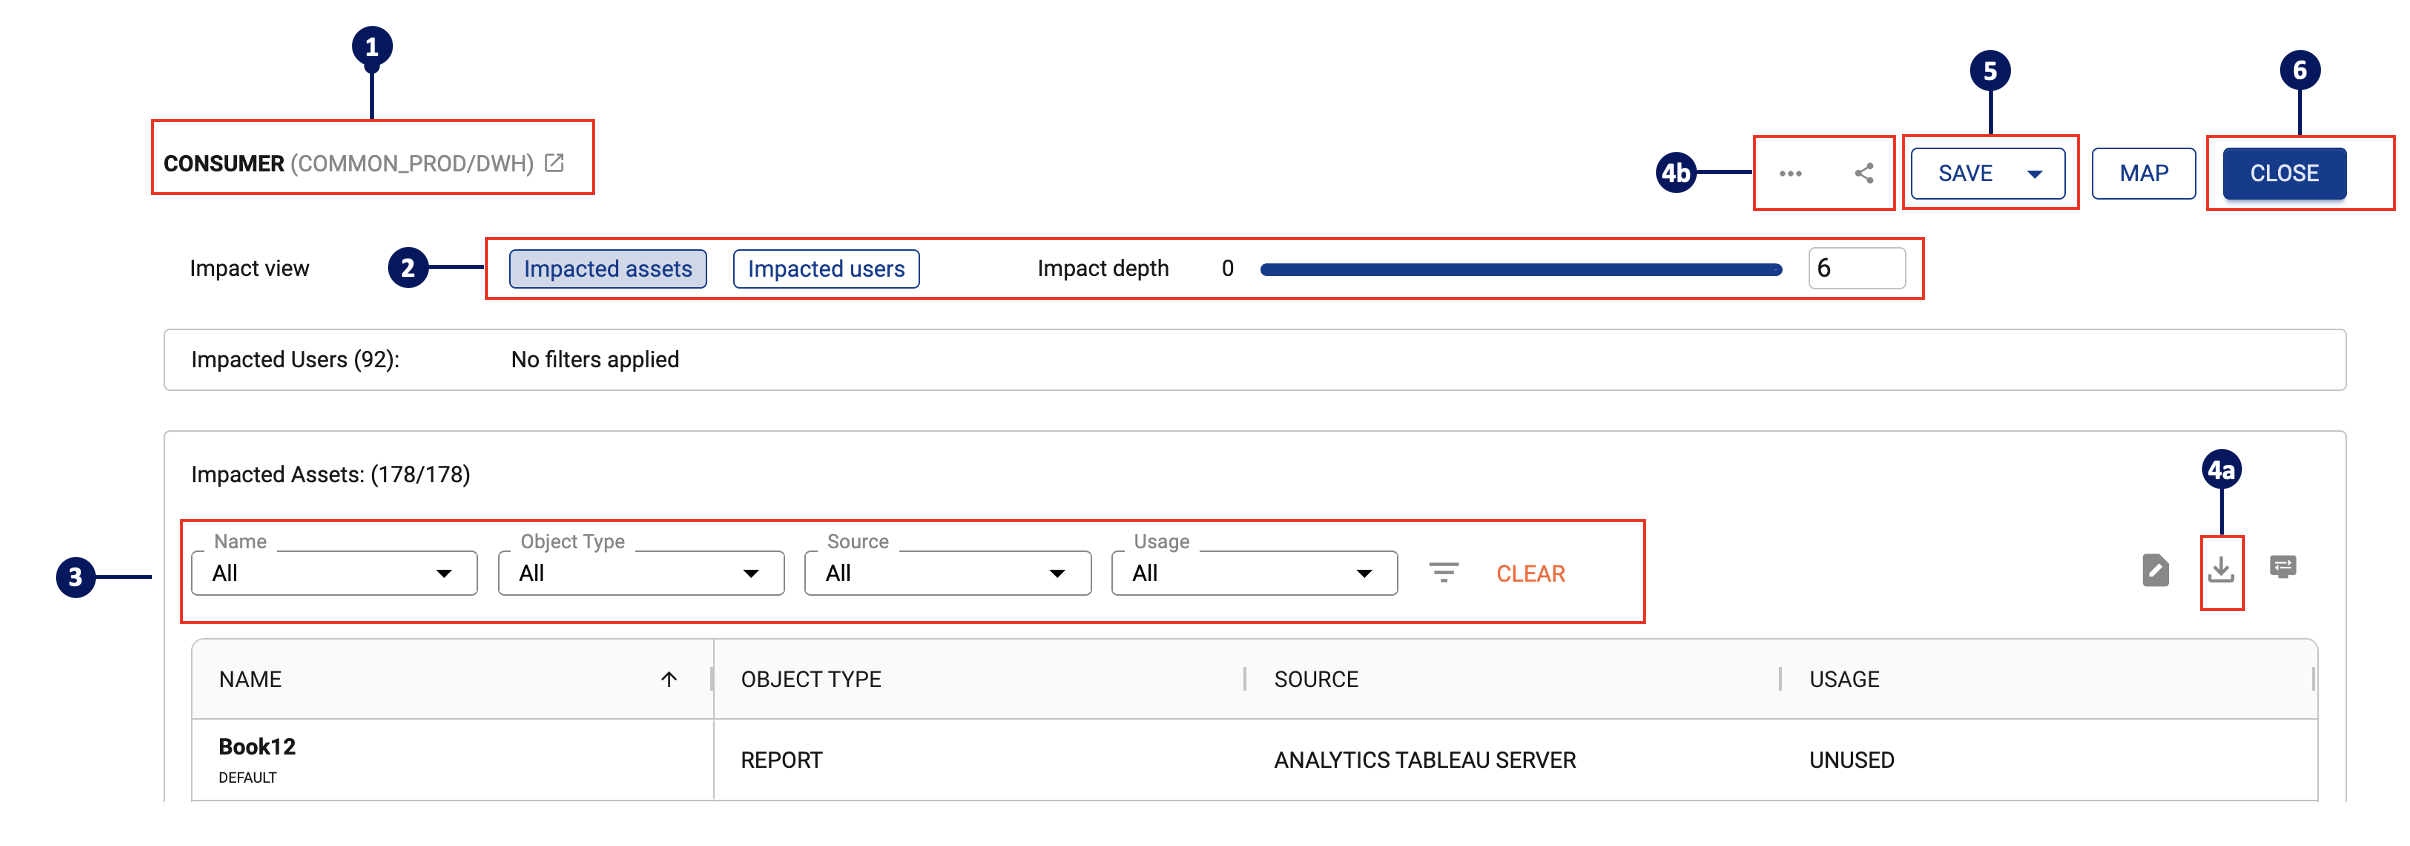
The asset is displayed in the header. Click on the open button to open the profile of the asset in a new tab
You can quickly toggle between impacted user/assets view. You can also filter the assets by depth - how far from the starting object it is by hops
Similar to the search results page, you can change the filters, download results or adjust the columns displayed.
You can down the results in several ways
You can also download list of results by clicking on the download button.
You can access additional downloads from the … menu
Once you have configured your preferred view, click Save to save the current filters. When you open the results in the future, the same filters will be saved
You can close the asset by clicking on the Close button. This will return you to the impact assessment history page.
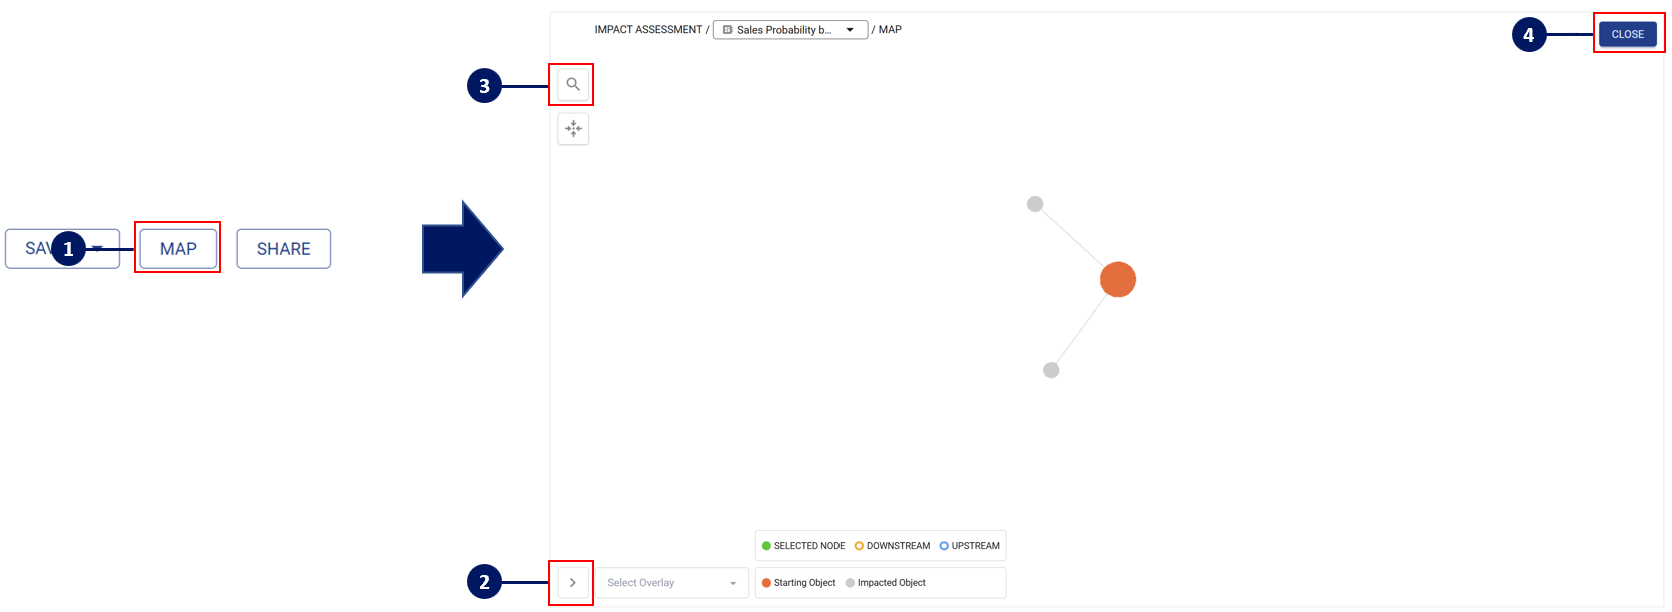
You can also toggle to a visual Map view. Things to note about the map view:
The map automatically applies the filters that you have set during the list view
Click on the bottom icon to expand the legend and apply any additional preferred overlays
When there are a large number of nodes, use the search function to quickly locate the node you are searching for
At any time, you can click Close to return to the list view
Additional actions available
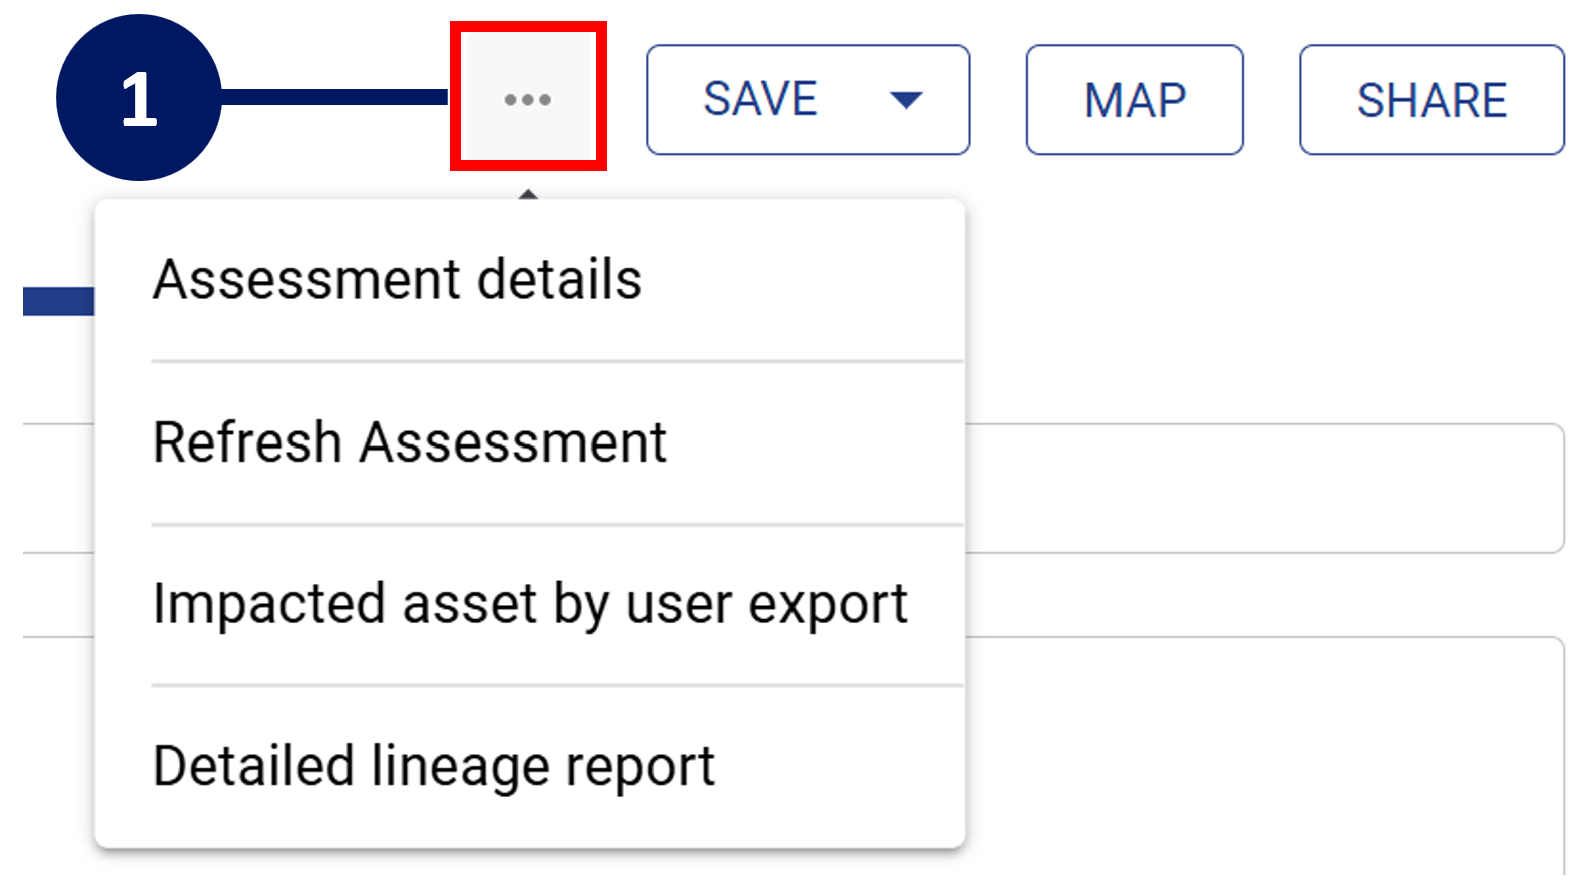
There are four additional actions available when you click on '…'
Assessment details: View the impact assessment settings
Refresh assessment: Refresh assessment with the latest sources that have been loaded to K
Impacted asset by user export: A list of all users and the impacted assets that they user
Detailed lineage report: A detailed excel that lists each connection row by row.
Refreshing an Impact assessment
On occasion an impact assessment may require a refresh. This may be due to historical assessments being purged due to archiving rules, or release related changes requiring a refresh of assessment results in order to update to the latest structure.
When an impact requires a refresh, its status will be put into “Pending” state. A tooltip will advise that a refresh is required.

To action the refresh, click on the assessment’s menu and select refresh assessment.
The assessment will begin refreshing and you will be notified when the assessment is ready (if email is configured).