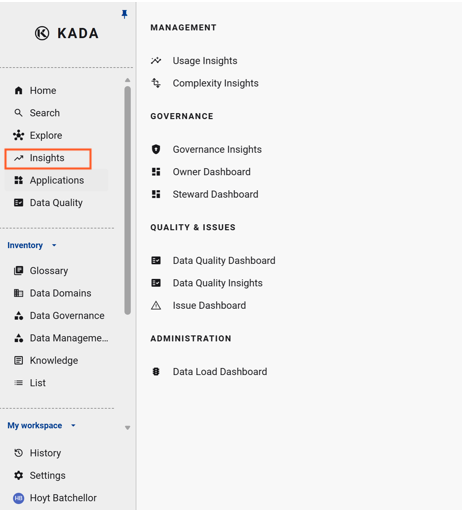
K has a number of helpful Dashboards and Insights pages to support Data Managers and Data Governance Managers in managing and governing their data ecosystem.
🔒 Insights are only accessible to users with Data Manager, Data Governance Manager, or Administrator roles. Business Users and Data Workers will not see this section.
Dashboard data is refreshed daily by default. Your K administrator can configure a more frequent refresh schedule or trigger an ad-hoc refresh via Batch Manager in Platform Settings.
Available Dashboards
Management
|
Dashboard Name |
Description |
|---|---|
|
Usage Insights |
Drill down on data usage for a specific source or tool — useful for planning migration activity |
|
Complexity Insights |
Understand how connected your data assets are to each other (upstream and downstream complexity) |
Governance
|
Dashboard Name |
Description |
|---|---|
|
Governance Insights |
Track classifications, ownership, and lineage quality across actively used data assets |
|
Data Owner Dashboard |
View governance, quality, and usage metrics for assets assigned to a specific Data Owner |
|
Data Steward Dashboard |
View governance, quality, and usage metrics for assets assigned to a specific Data Steward |
Quality & Issues
|
Dashboard Name |
Description |
|---|---|
|
Data Quality Dashboard |
View DQ metrics across domains, categories, and use cases |
|
Data Quality Insights |
Drill through DQ by source, domain, collection, or DQ tool |
|
Issue Dashboard |
View issues raised on data and content — filter by domain, status, and priority |
Administration
|
Dashboard Name |
Description |
|---|---|
|
Data Load Dashboard |
Check the current state of metadata loads from connected sources |
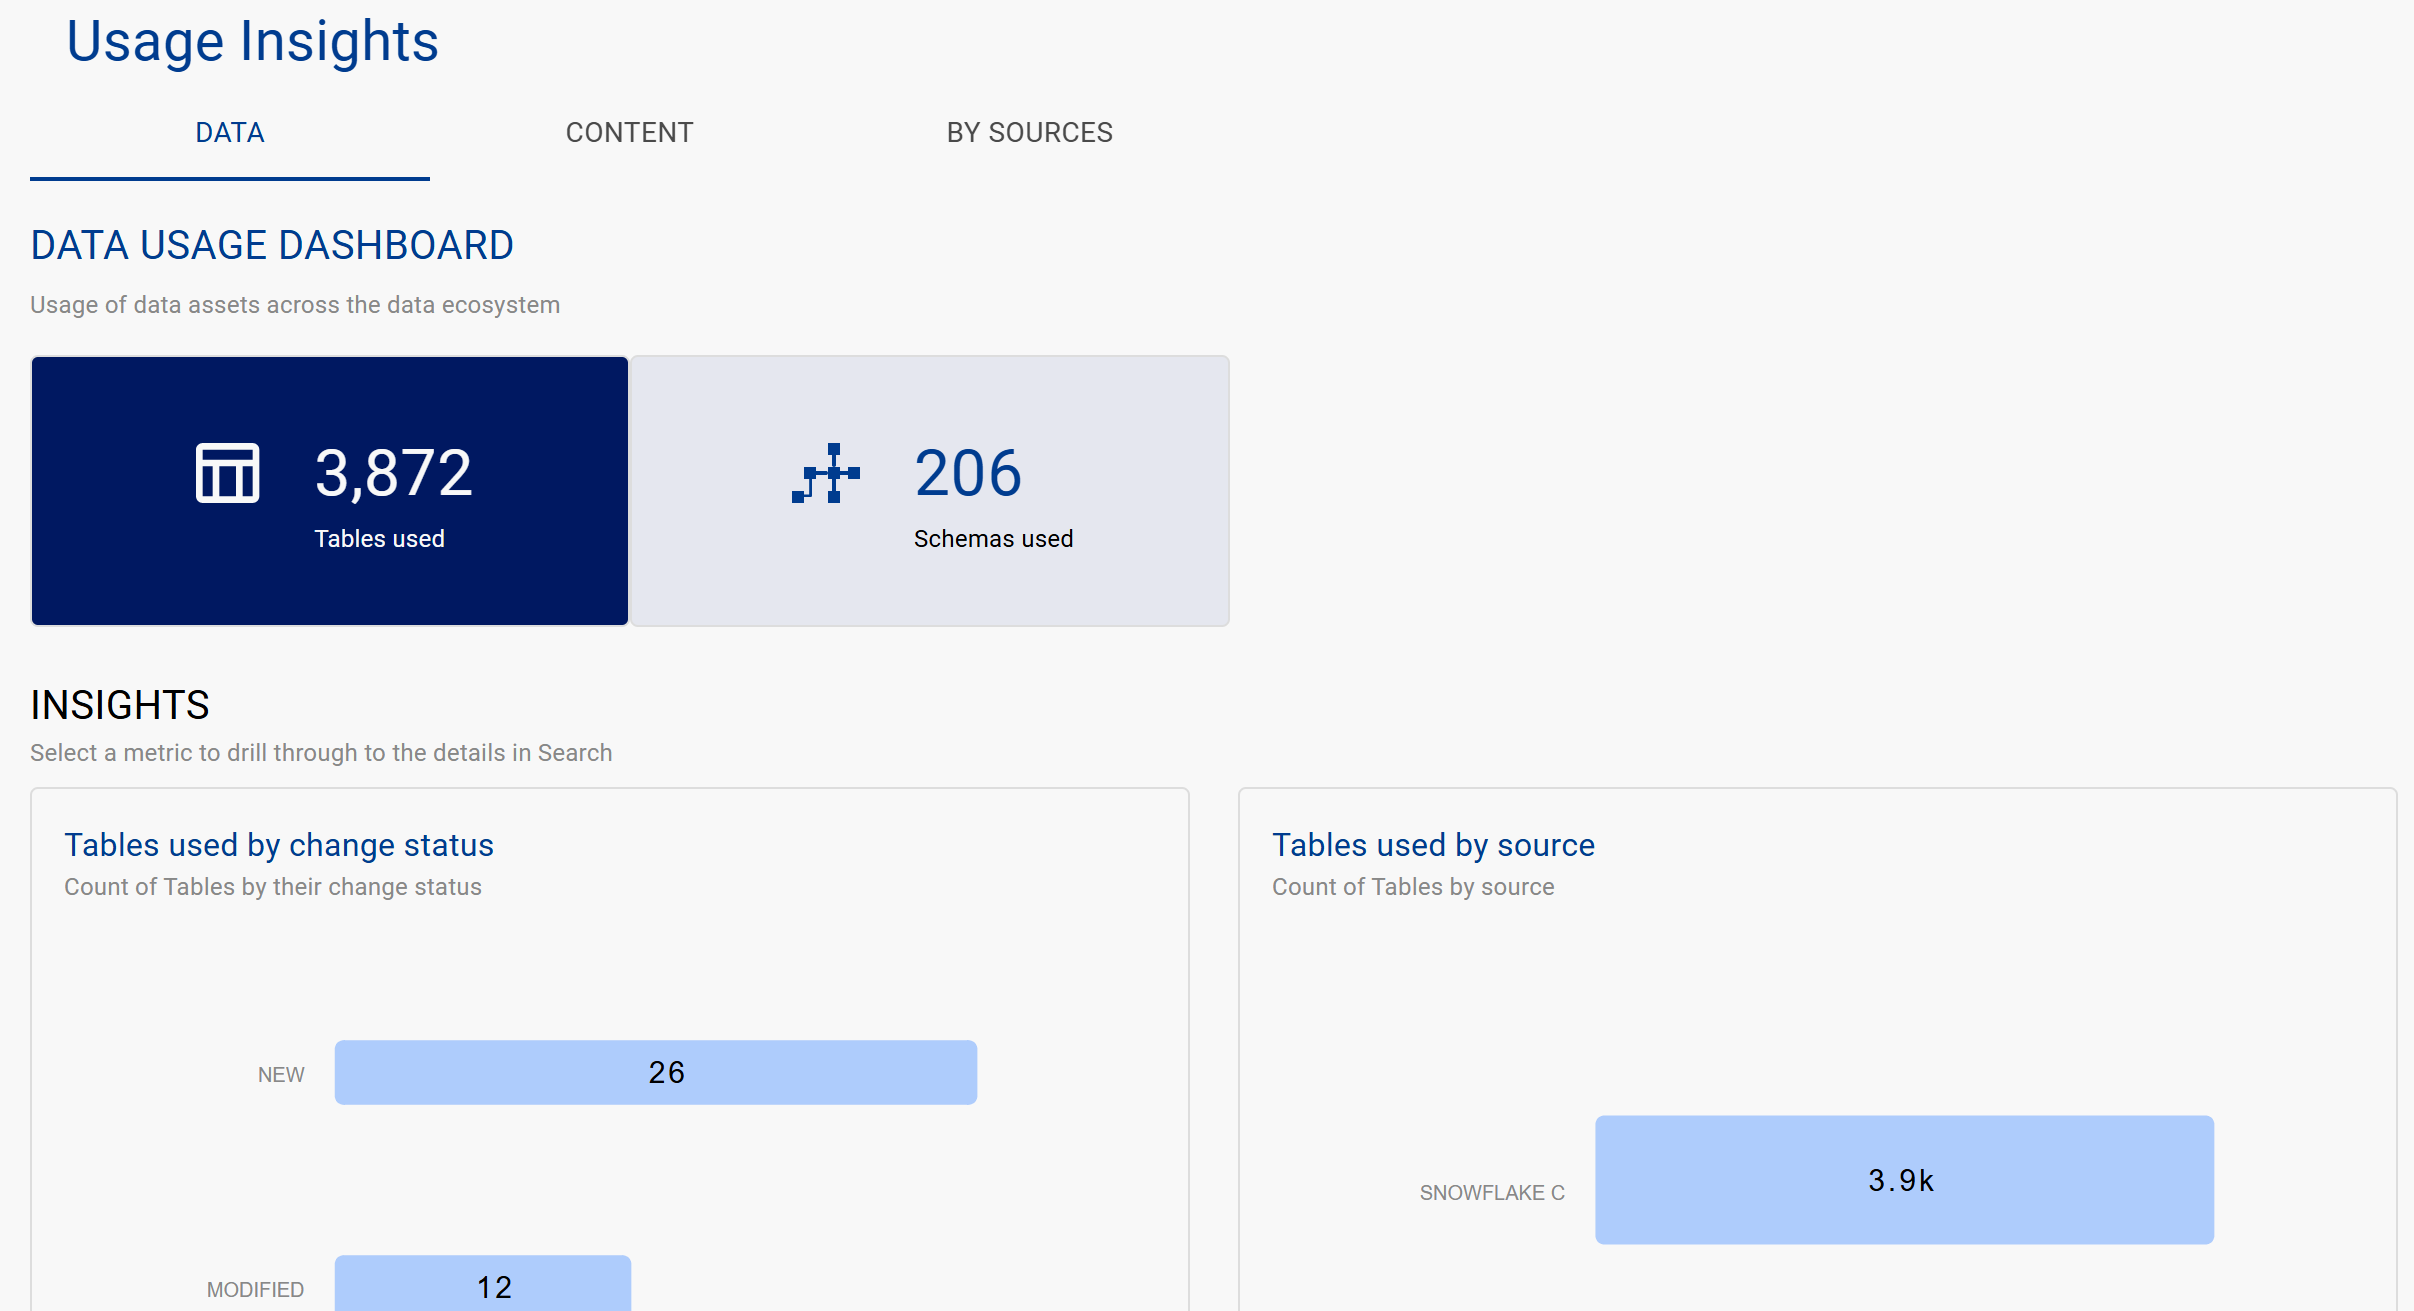
Usage Insights
The Usage Insights page lets you drill down on usage information for a specific source or tool. Particularly useful when planning migration activity.
Usage frequency is calculated as follows:
|
Frequency |
Calculation |
|---|---|
|
Daily |
Used in 10+ workdays over the last 3 weeks |
|
Weekly |
Used in 3 different weeks over the last 4 weeks |
|
Monthly |
Used in 3 different months over the last 4 months |
|
Infrequent |
Used at least once within the last 4 months |
|
Unused |
Not used within the last 4 months |
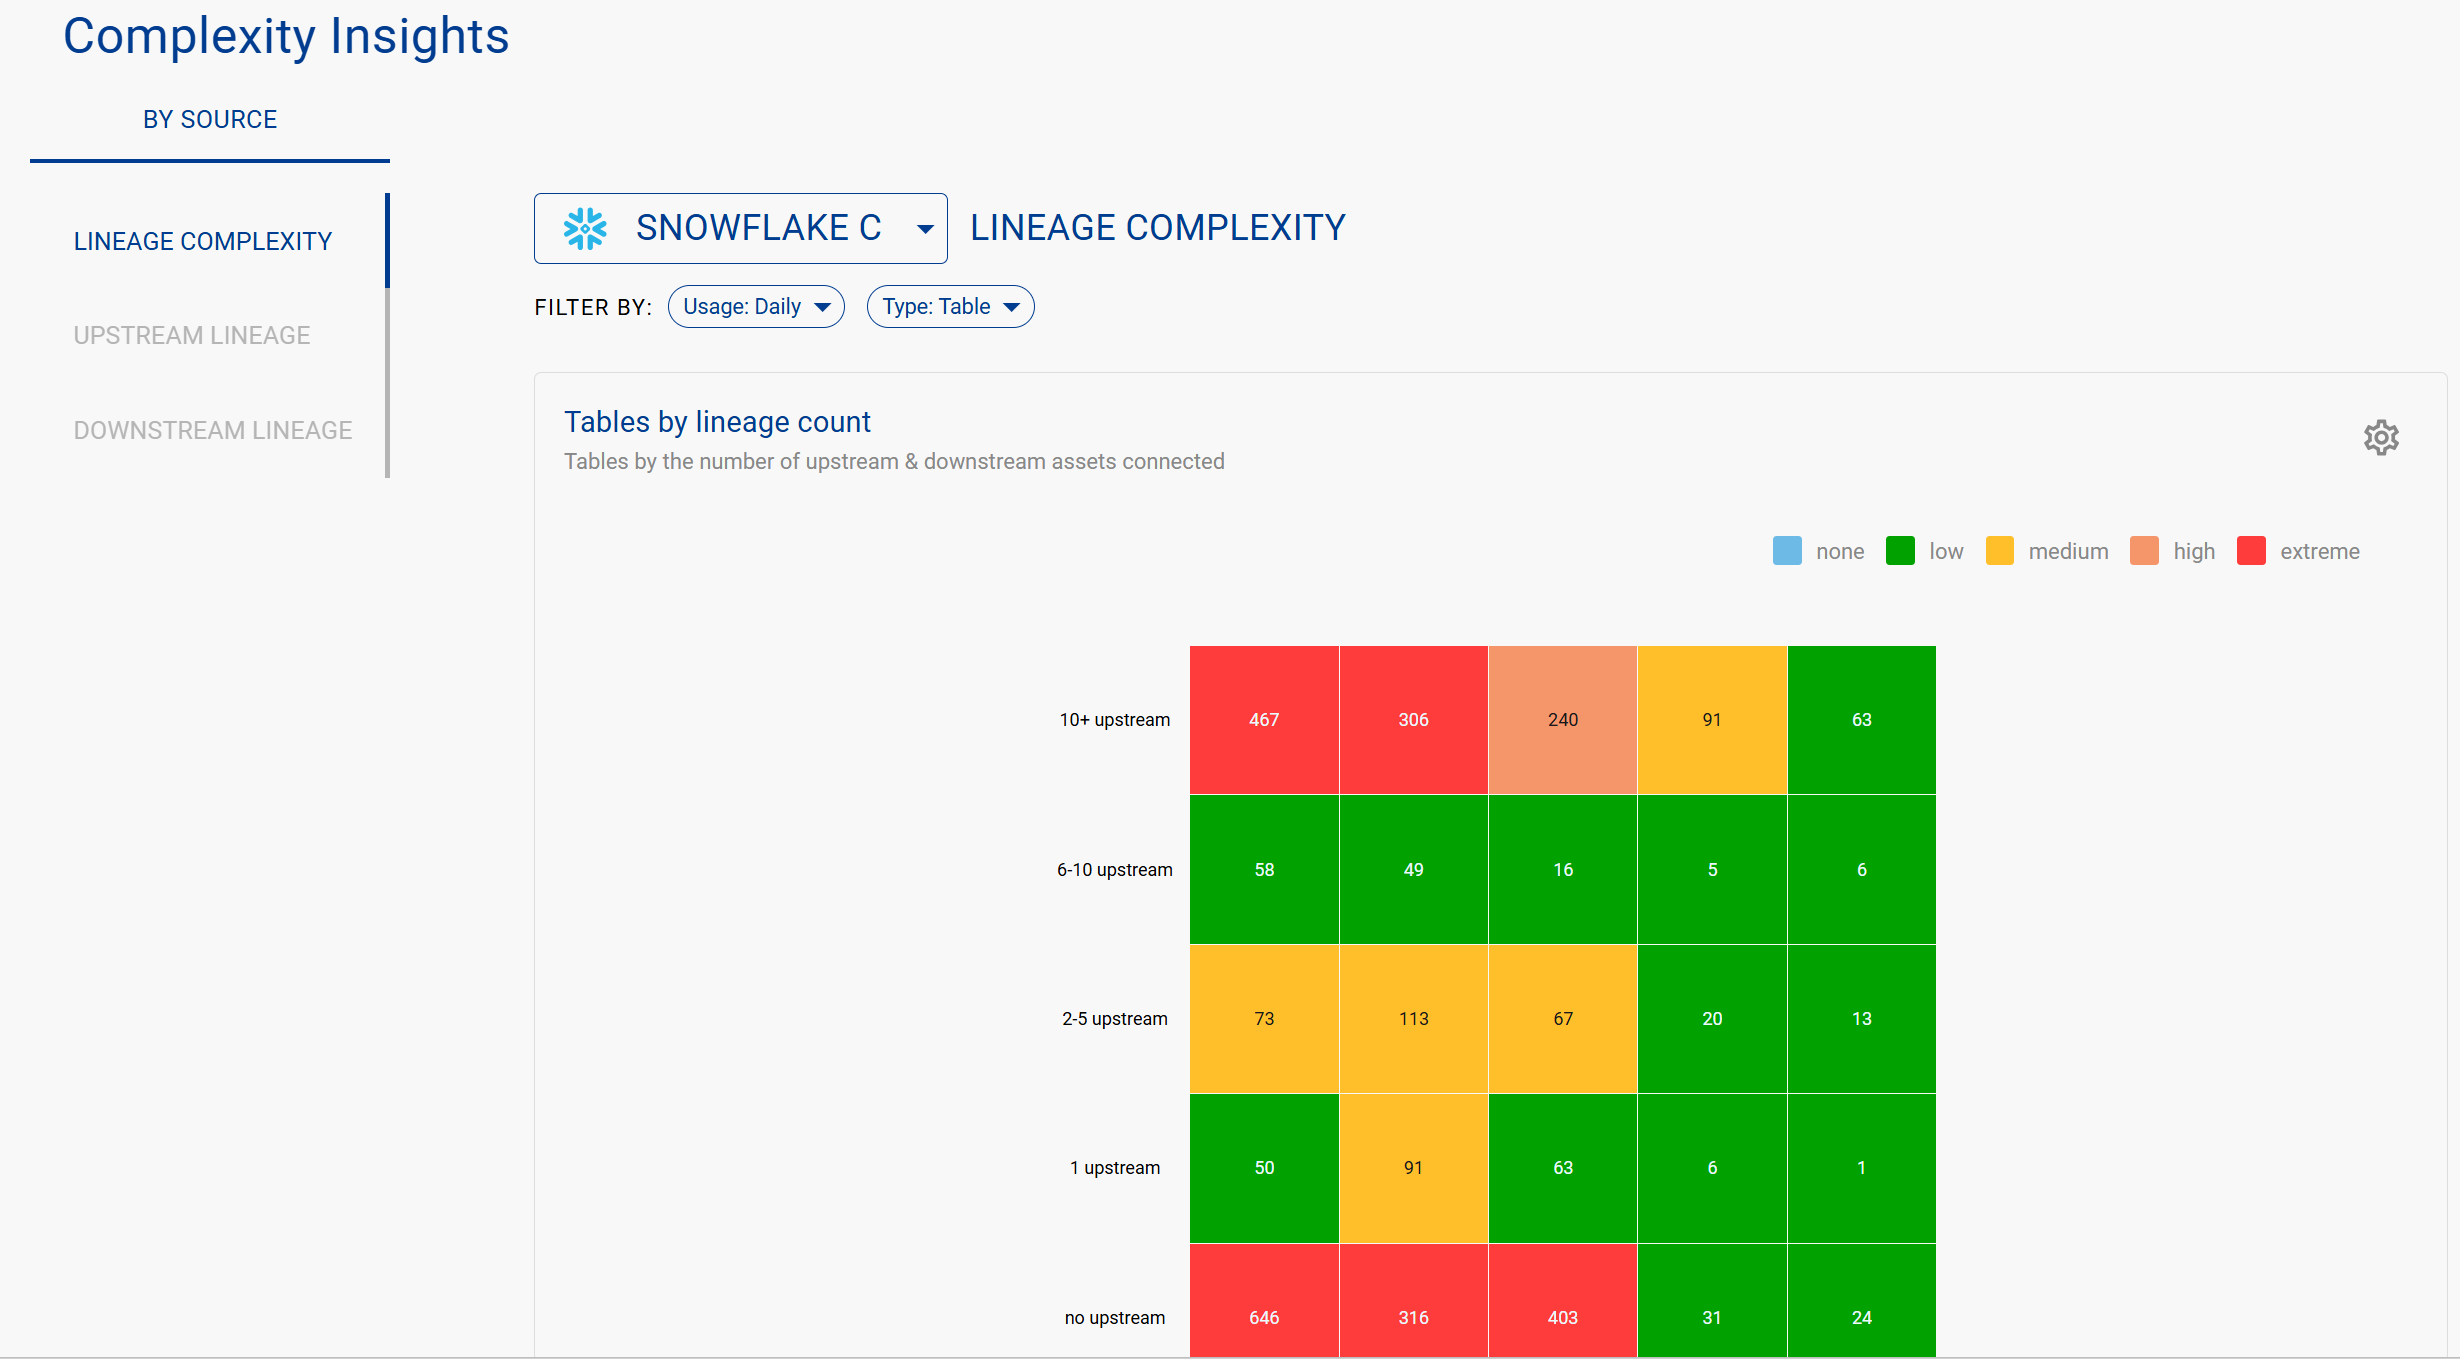
Complexity Insights
Use Complexity Insights to understand how connected your data assets are. You can select upstream, downstream, or both views, and customise the complexity ranges using the settings icon.
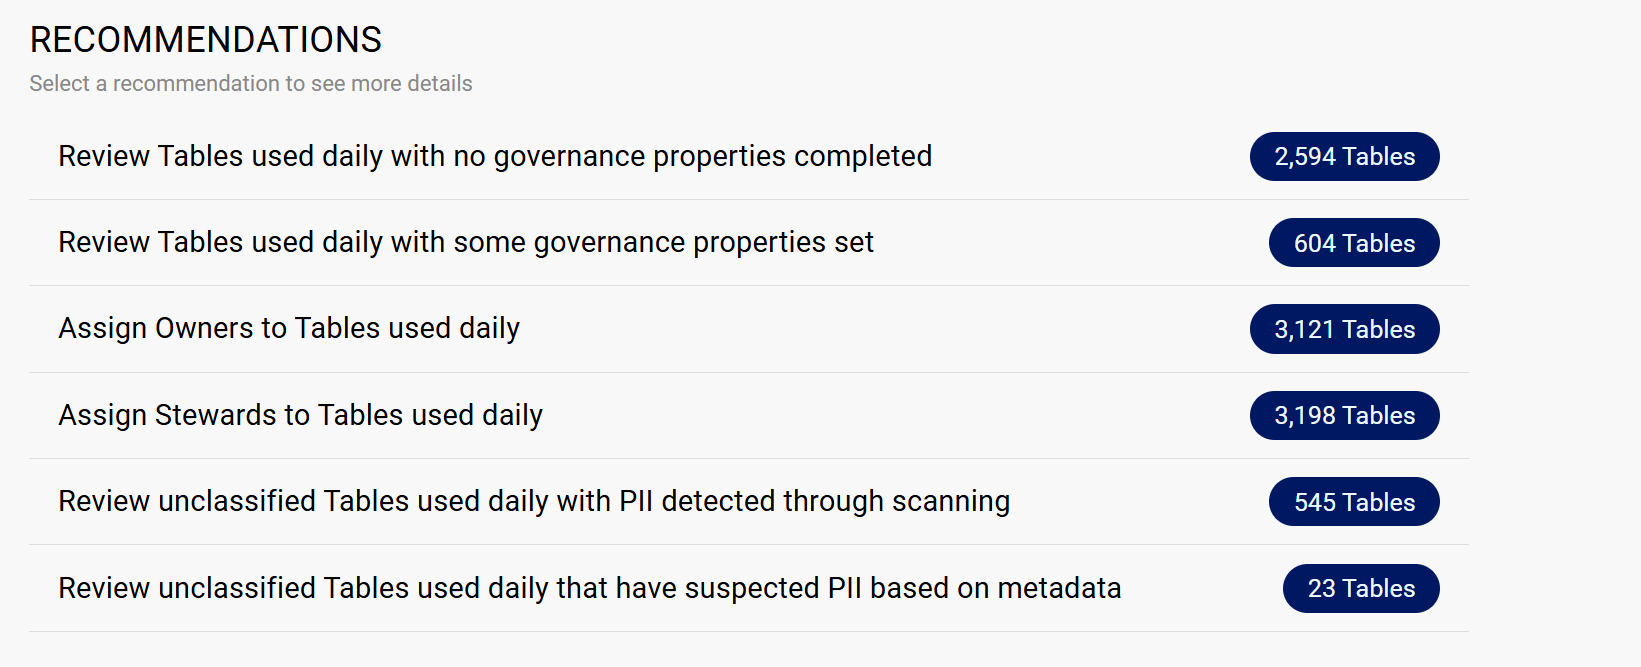
Governance Insights
Use the Governance Insights dashboard to track classifications, ownership, and lineage quality across data assets that are being actively used.
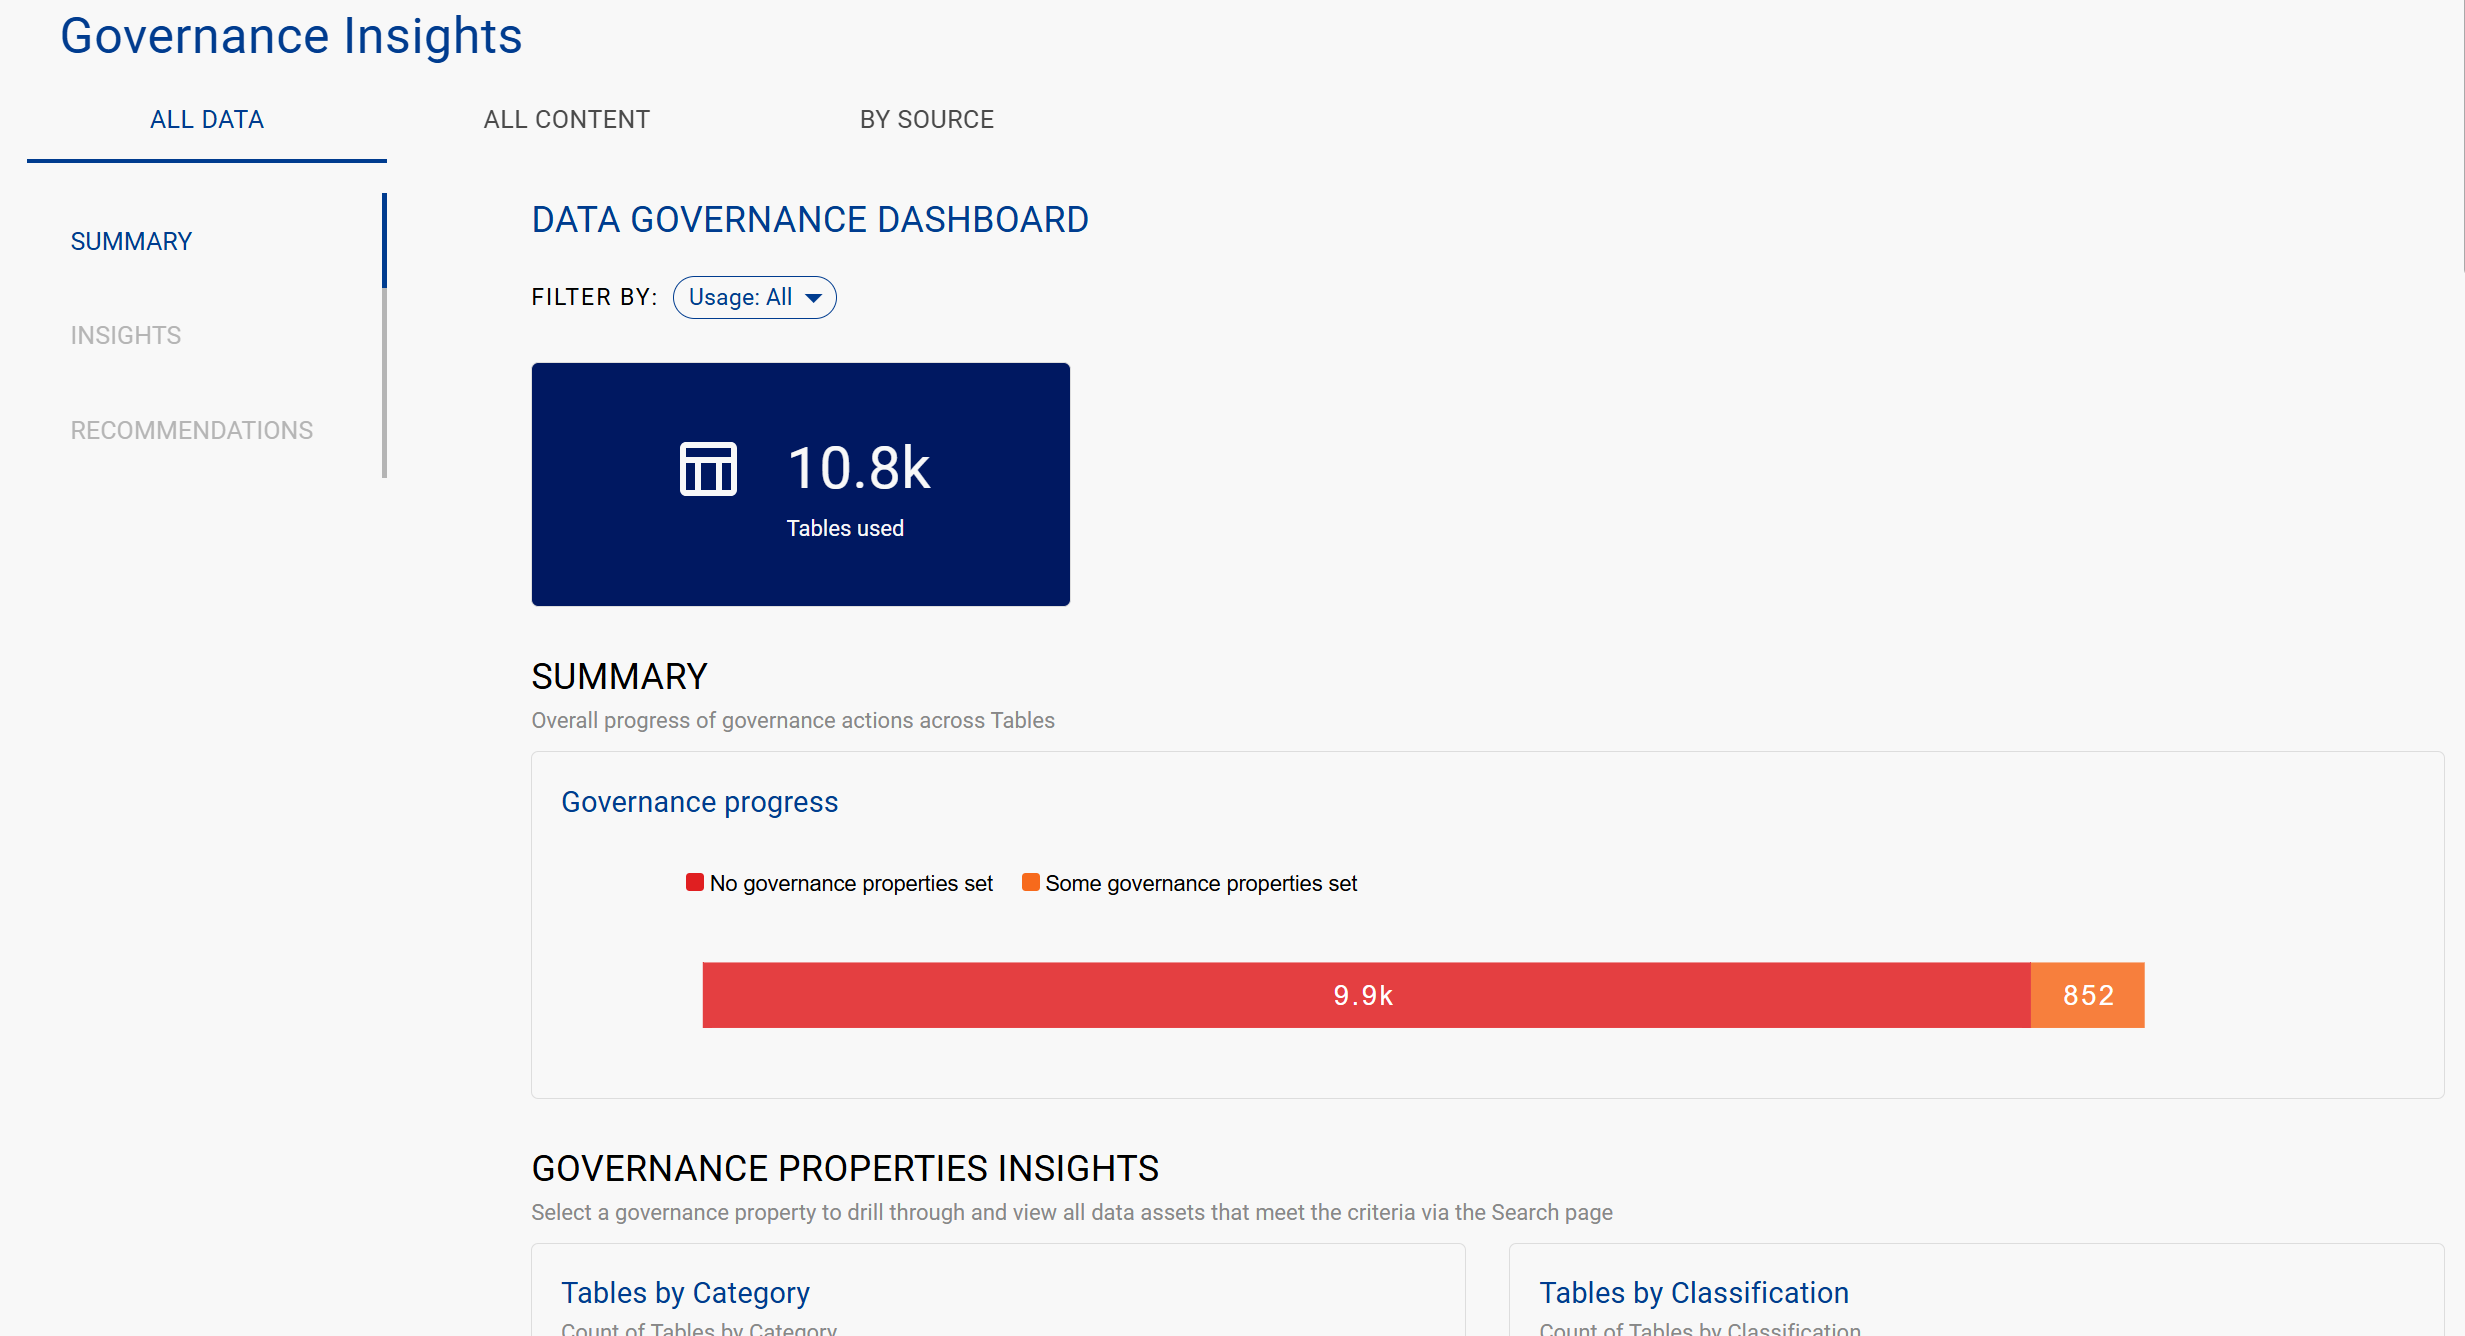
It also surfaces Recommendations for assets that are missing Data Owners or Stewards.
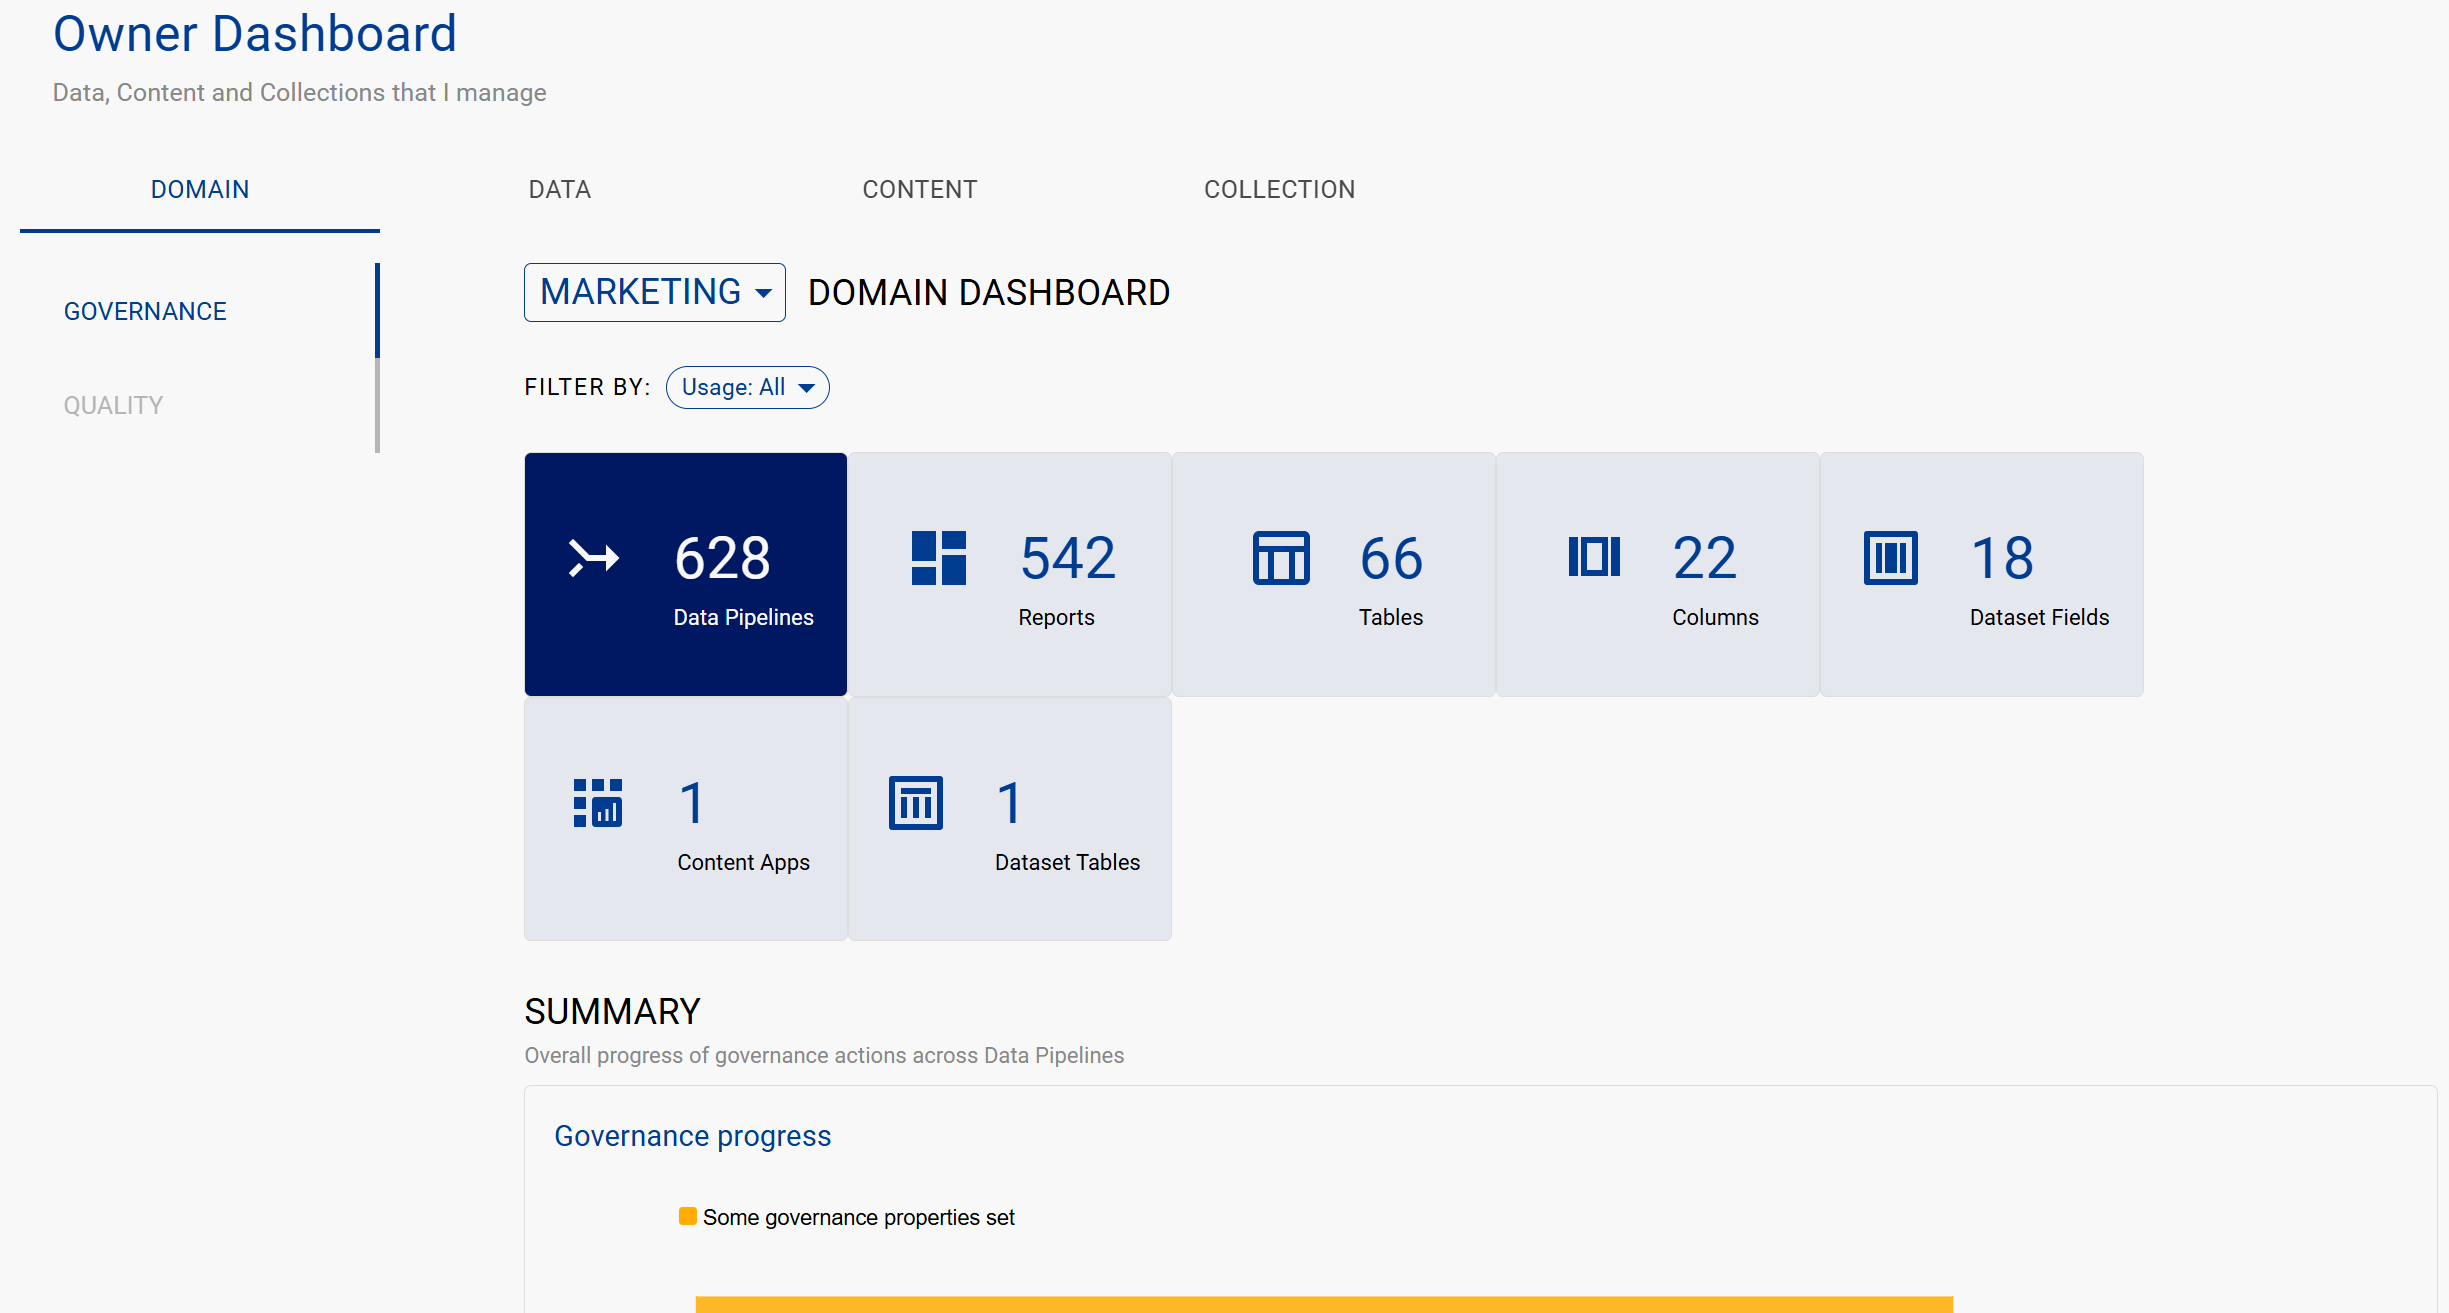
Data Owner & Steward Dashboards
The Owner and Steward Dashboards provide each Data Owner or Data Steward with a focused view of the governance, quality, and usage metrics for their assets.
See Data Owner & Steward Dashboard for full details.
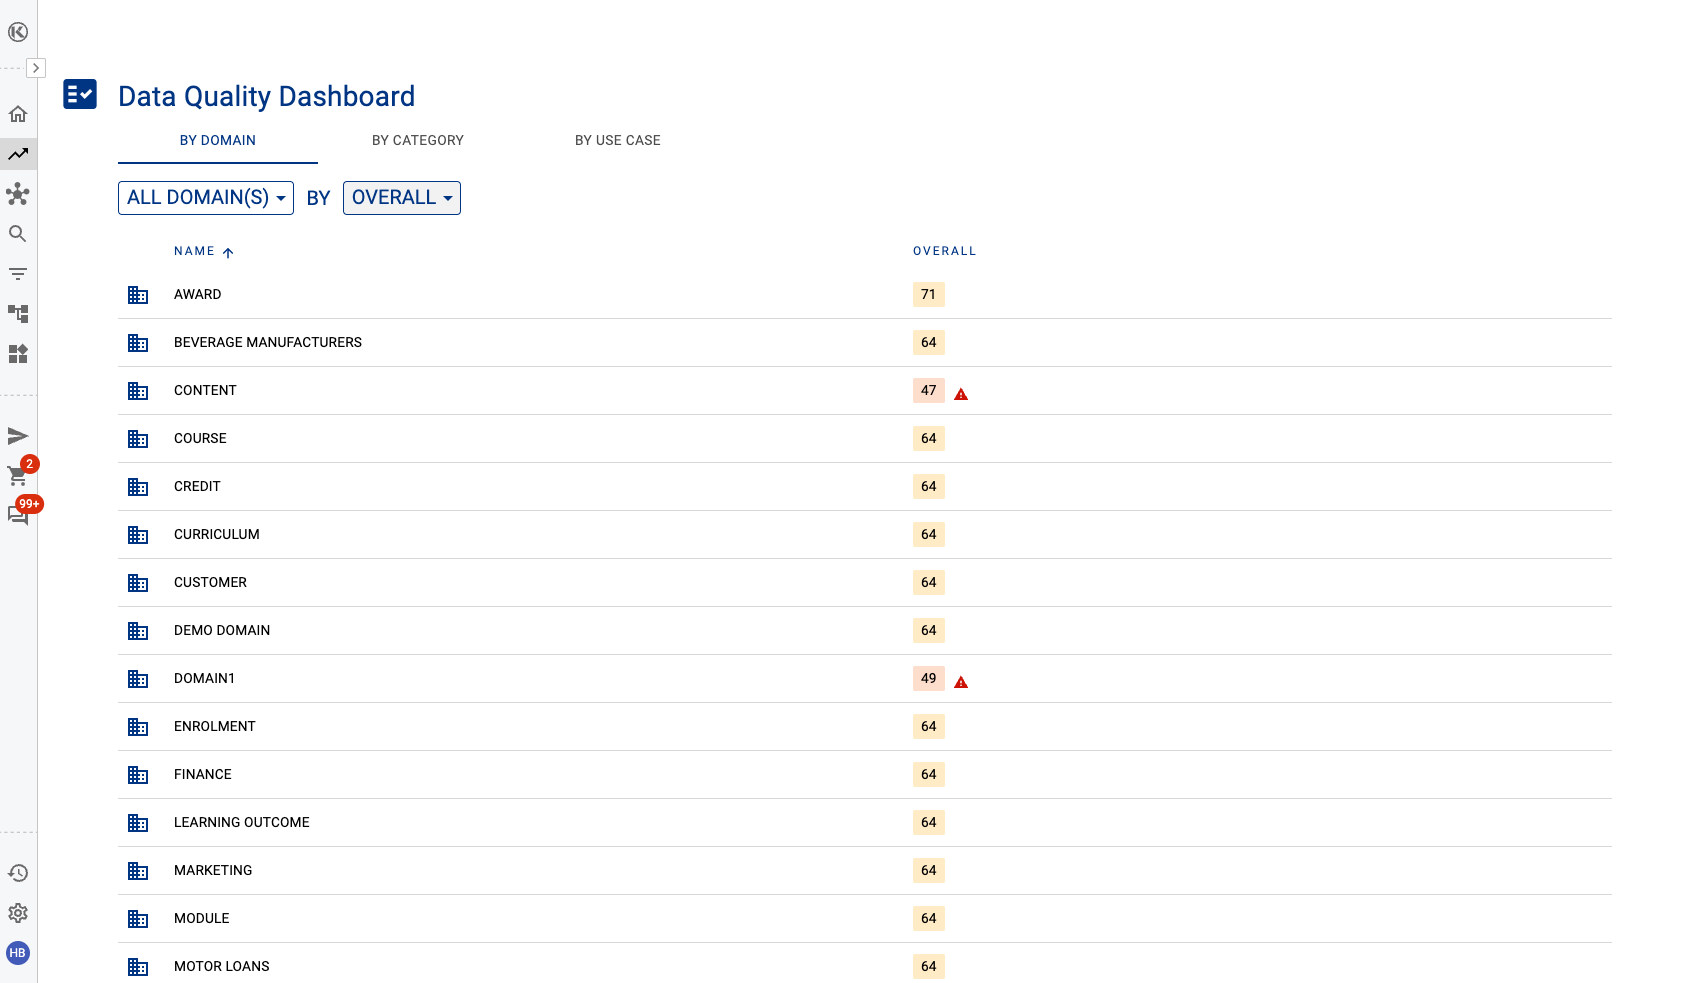
Data Quality Dashboard
The Data Quality Dashboard provides an overview of DQ across domains, categories, and use cases. This dashboard is useful for comparing DQ trends across critical areas.
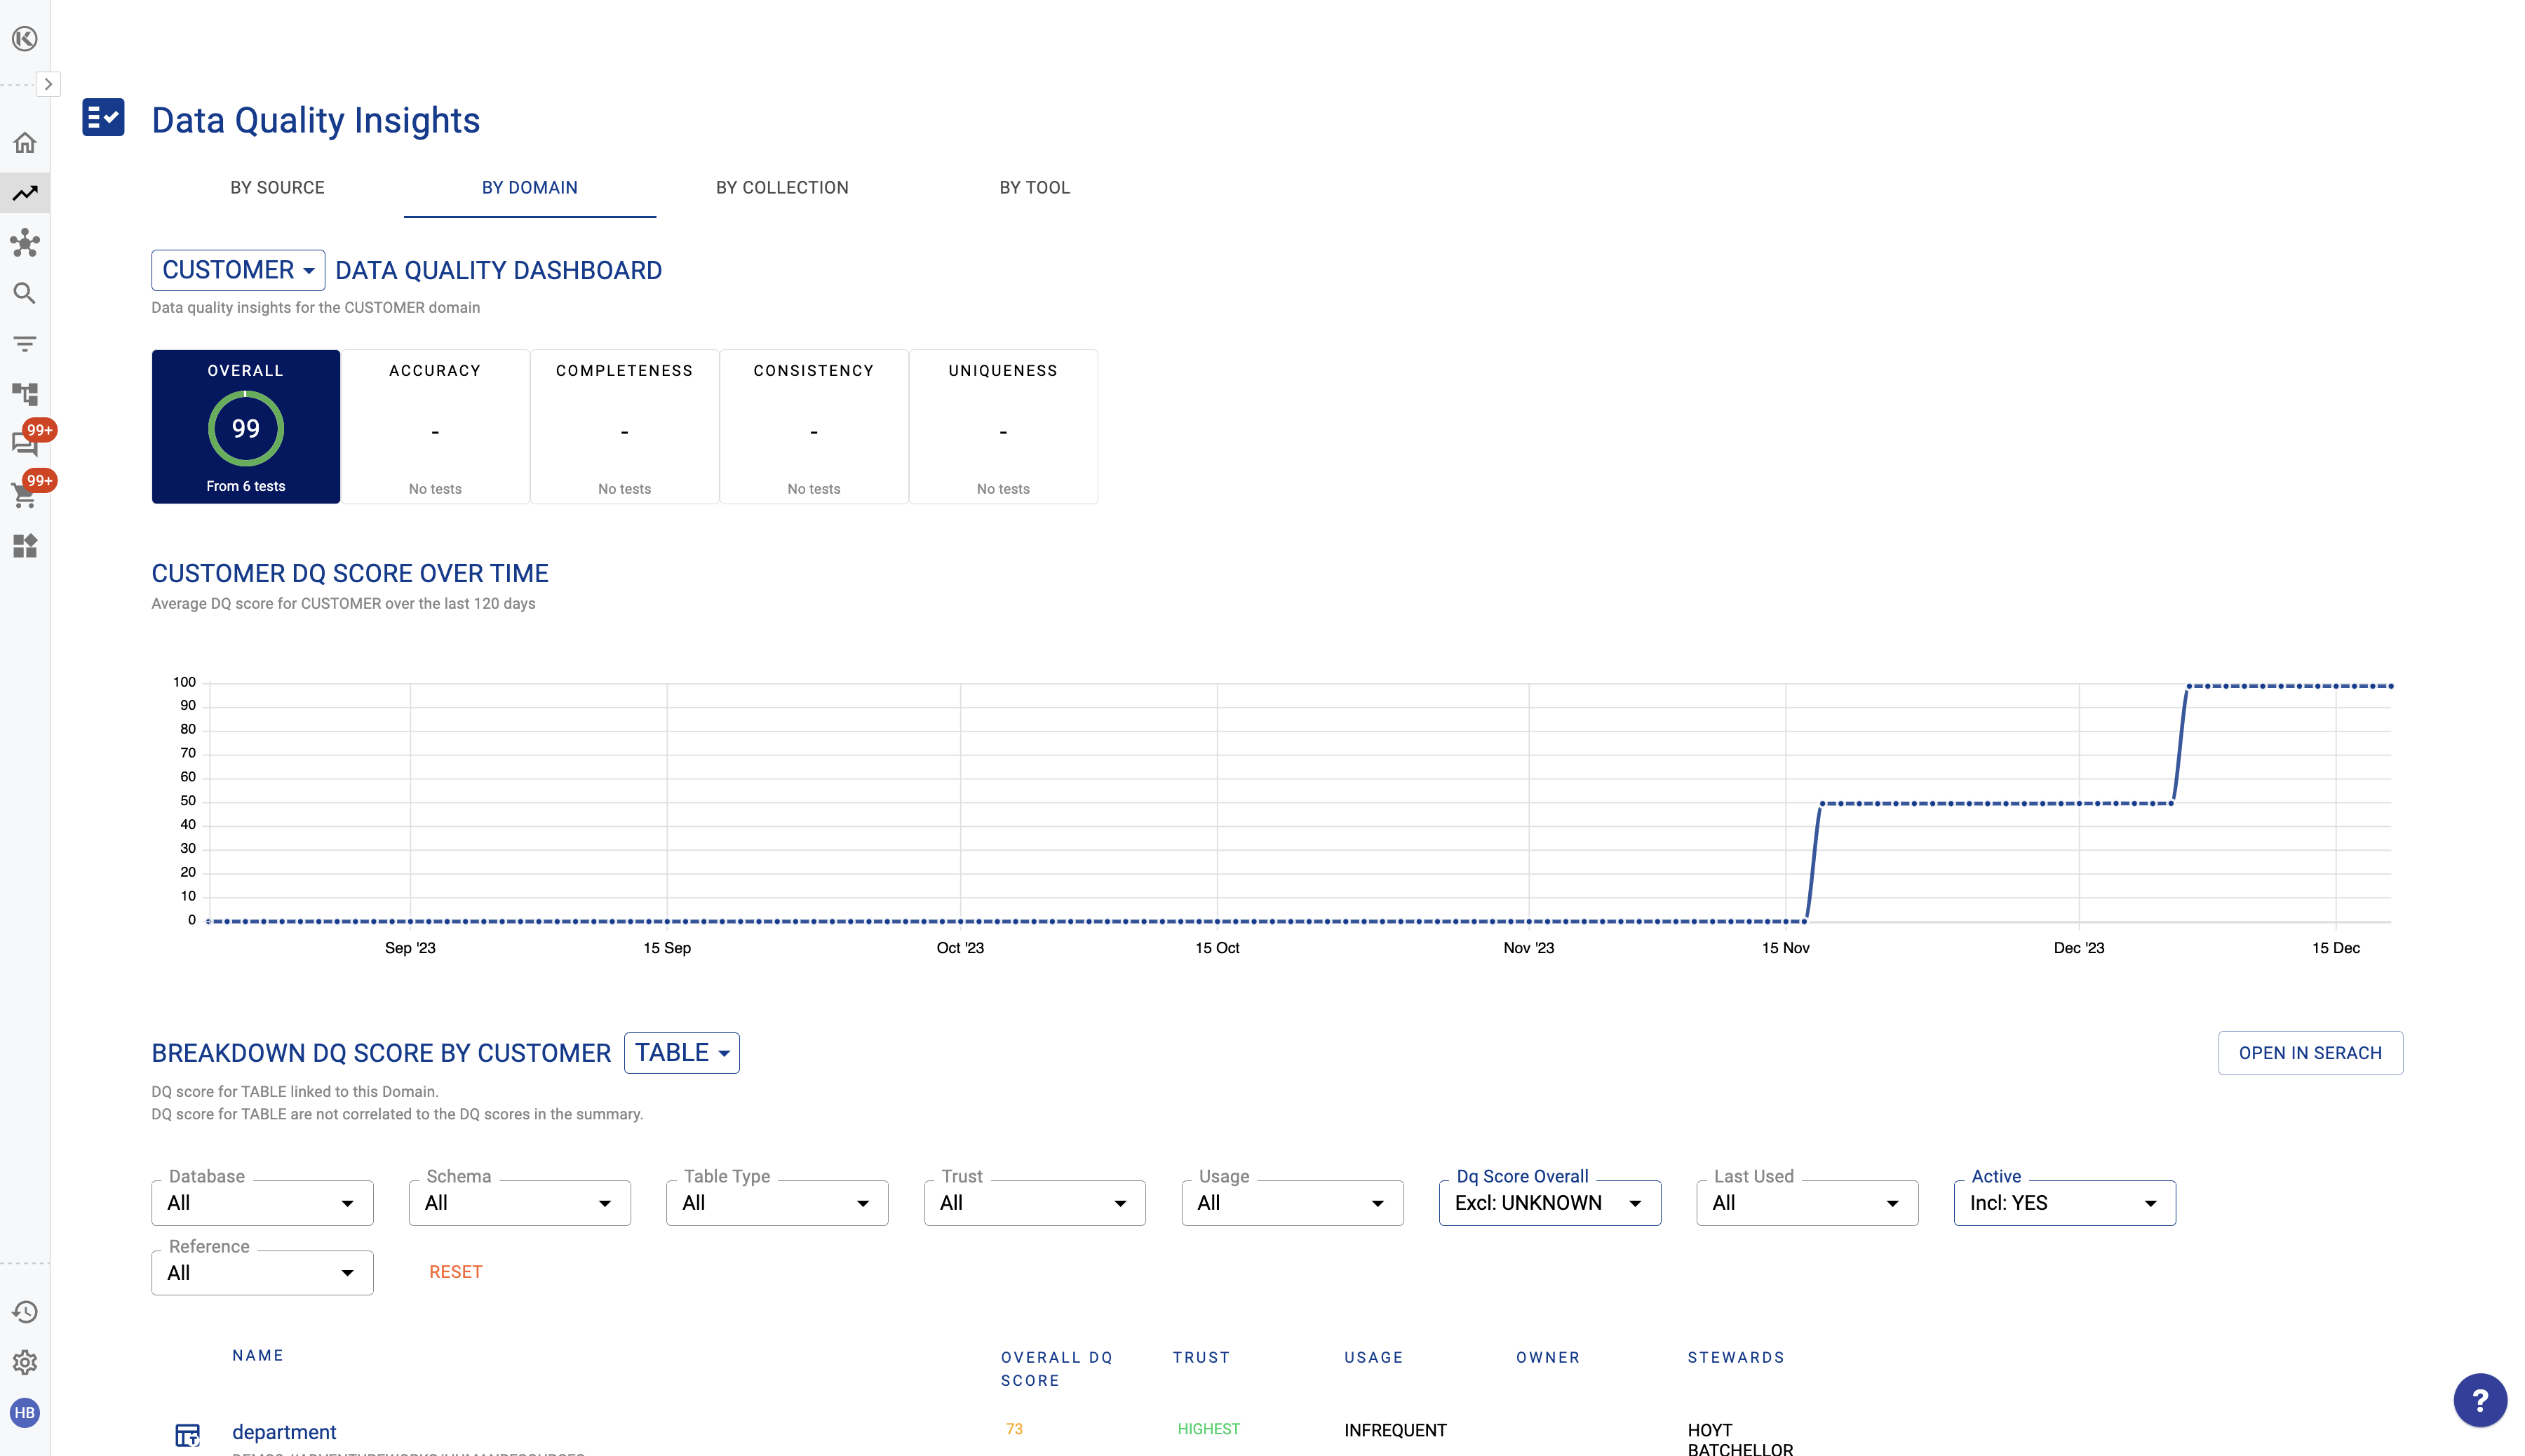
Data Quality Insights
The Data Quality Insights page lets you drill through to source, domain, collection, or DQ tool level.
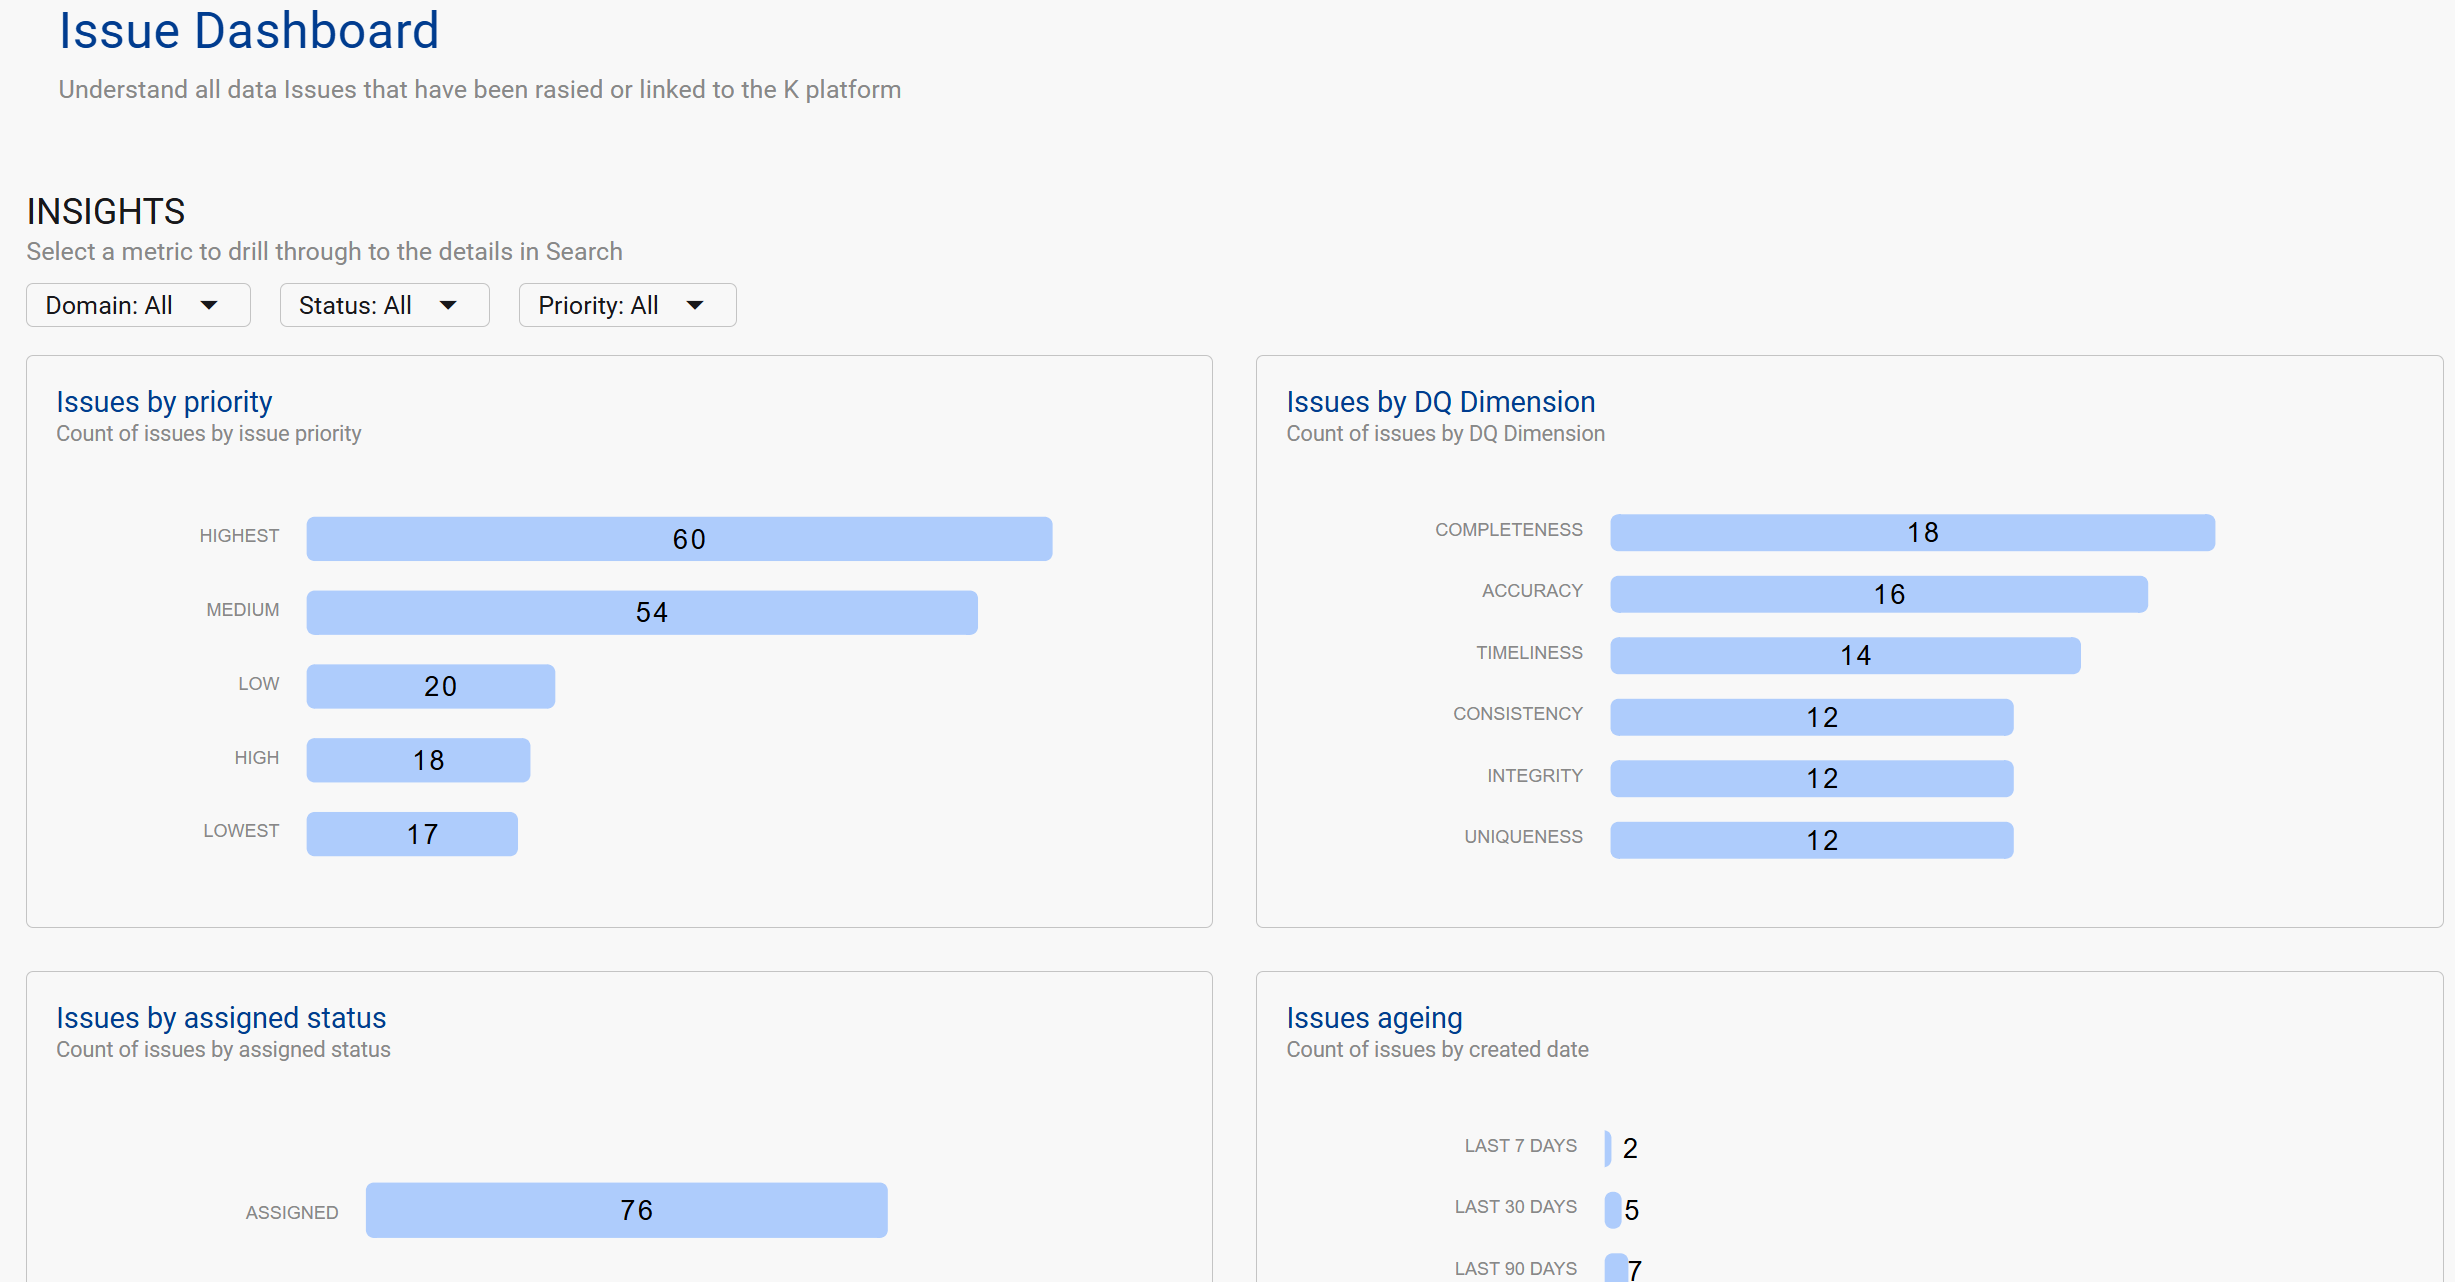
Issue Dashboard
The Issue Dashboard provides a summary of all data issues raised in K — filterable by Domain, Status, and Priority. Click any data point to see a list of matching issues, or click Open in Search to download.
Data Load Dashboard
Use the Data Load Dashboard to check the current state of source loads into K — view which sources have successfully ingested metadata and flag any load failures.
Tips on Getting the Most from Dashboards
|
Dashboard |
Scenario |
How K Helps |
|---|---|---|
|
Usage Insights |
Planning a migration |
Filter by data source to see how heavily it's used and which teams to engage |
|
Governance Dashboard |
Tracking DG KPIs |
Identify governance gaps across used assets vs. unused assets |
|
Data Quality Dashboard |
Tracking DQ trends across domains |
Identify which assets within a domain are causing the most quality impact |
|
Issue Dashboard |
Reviewing crowd-sourced issues |
Get an overview of current issues and their status — download for reporting |
|
Data Load Dashboard |
Checking platform health |
See the current state of source loads into K |