UPDATED IN RELEASE 6.1
The Data Quality Dashboard shows the Data Quality Health of your ecosystem and lets you quickly see what percentage of your data assets are passing or failing the DQ Tests.
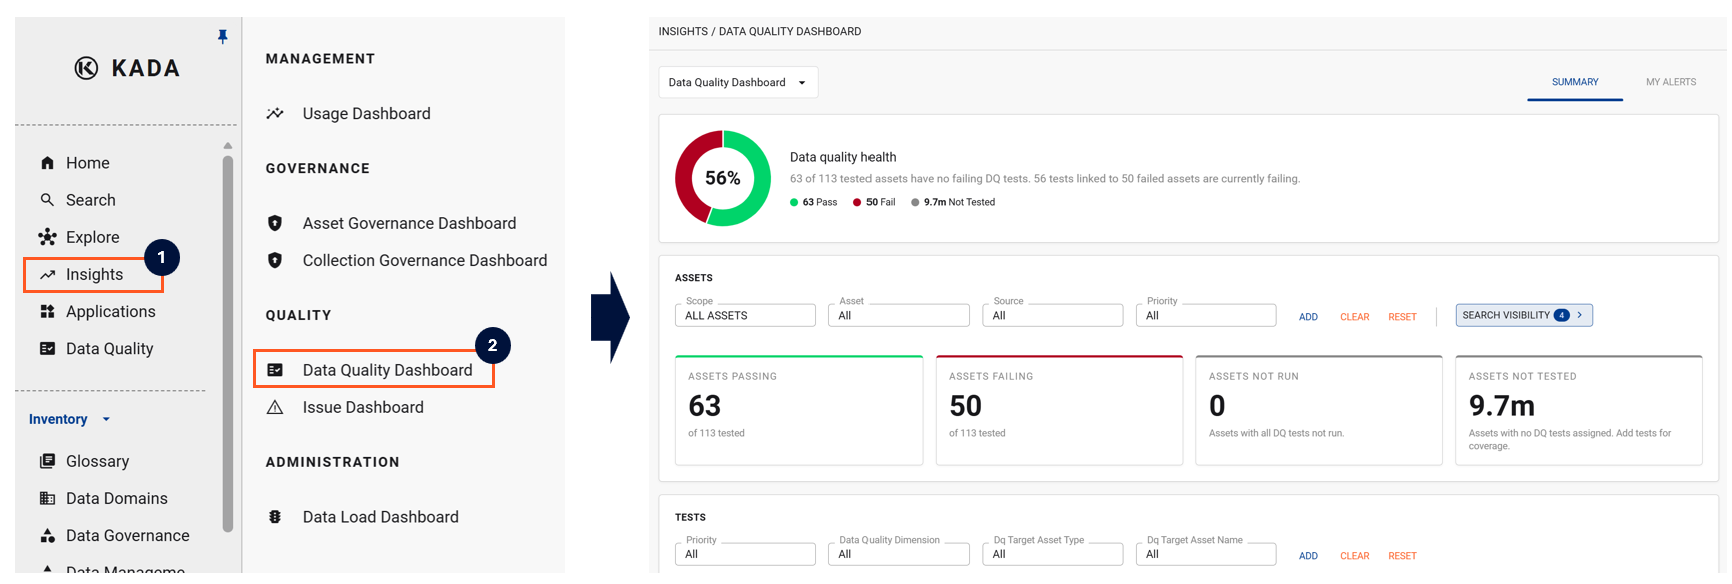
You can drill through on any of the graphs to see the underlying assets through the search view. Using this method, you can also quickly set up regular alerts to help monitor the underlying assets.
Customising your Dashboard
The top part of your dashboard has a number of filters that you can drill down and refine. Similar to the Search pages, you can choose to add additional filters.
When you change your filter settings, K will remember your last filter settings and retain them. Click reset to change the filters back to the default options
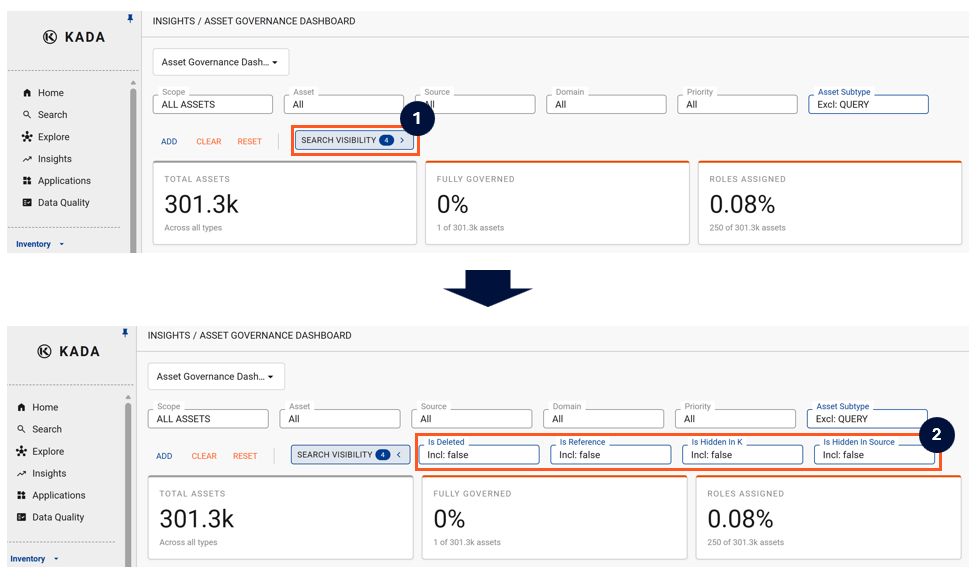
By default, there are a number of standard filters that have been set. These include:
-
Deleted: False (exclude all deleted assets)
-
Reference: False (do not include reference assets)
-
Hidden in K: False (assets that your Data Governance Managers and Admin users have chosen to hide and not have displayed in K by default)
-
Hidden in Source: (assets that are hidden in the Source system)
To view and change these default settings, click the Search Visibility button.