UPDATED IN VERSION 6.1
The Usage Dashboard page lets you drill down on usage information for your data asset and help identify ways to optimise your data ecocystem. This includes:
-
Unused data assets that could potentially be decommissioned
-
Identifying which infrequently used assets are taking up significant storage space
-
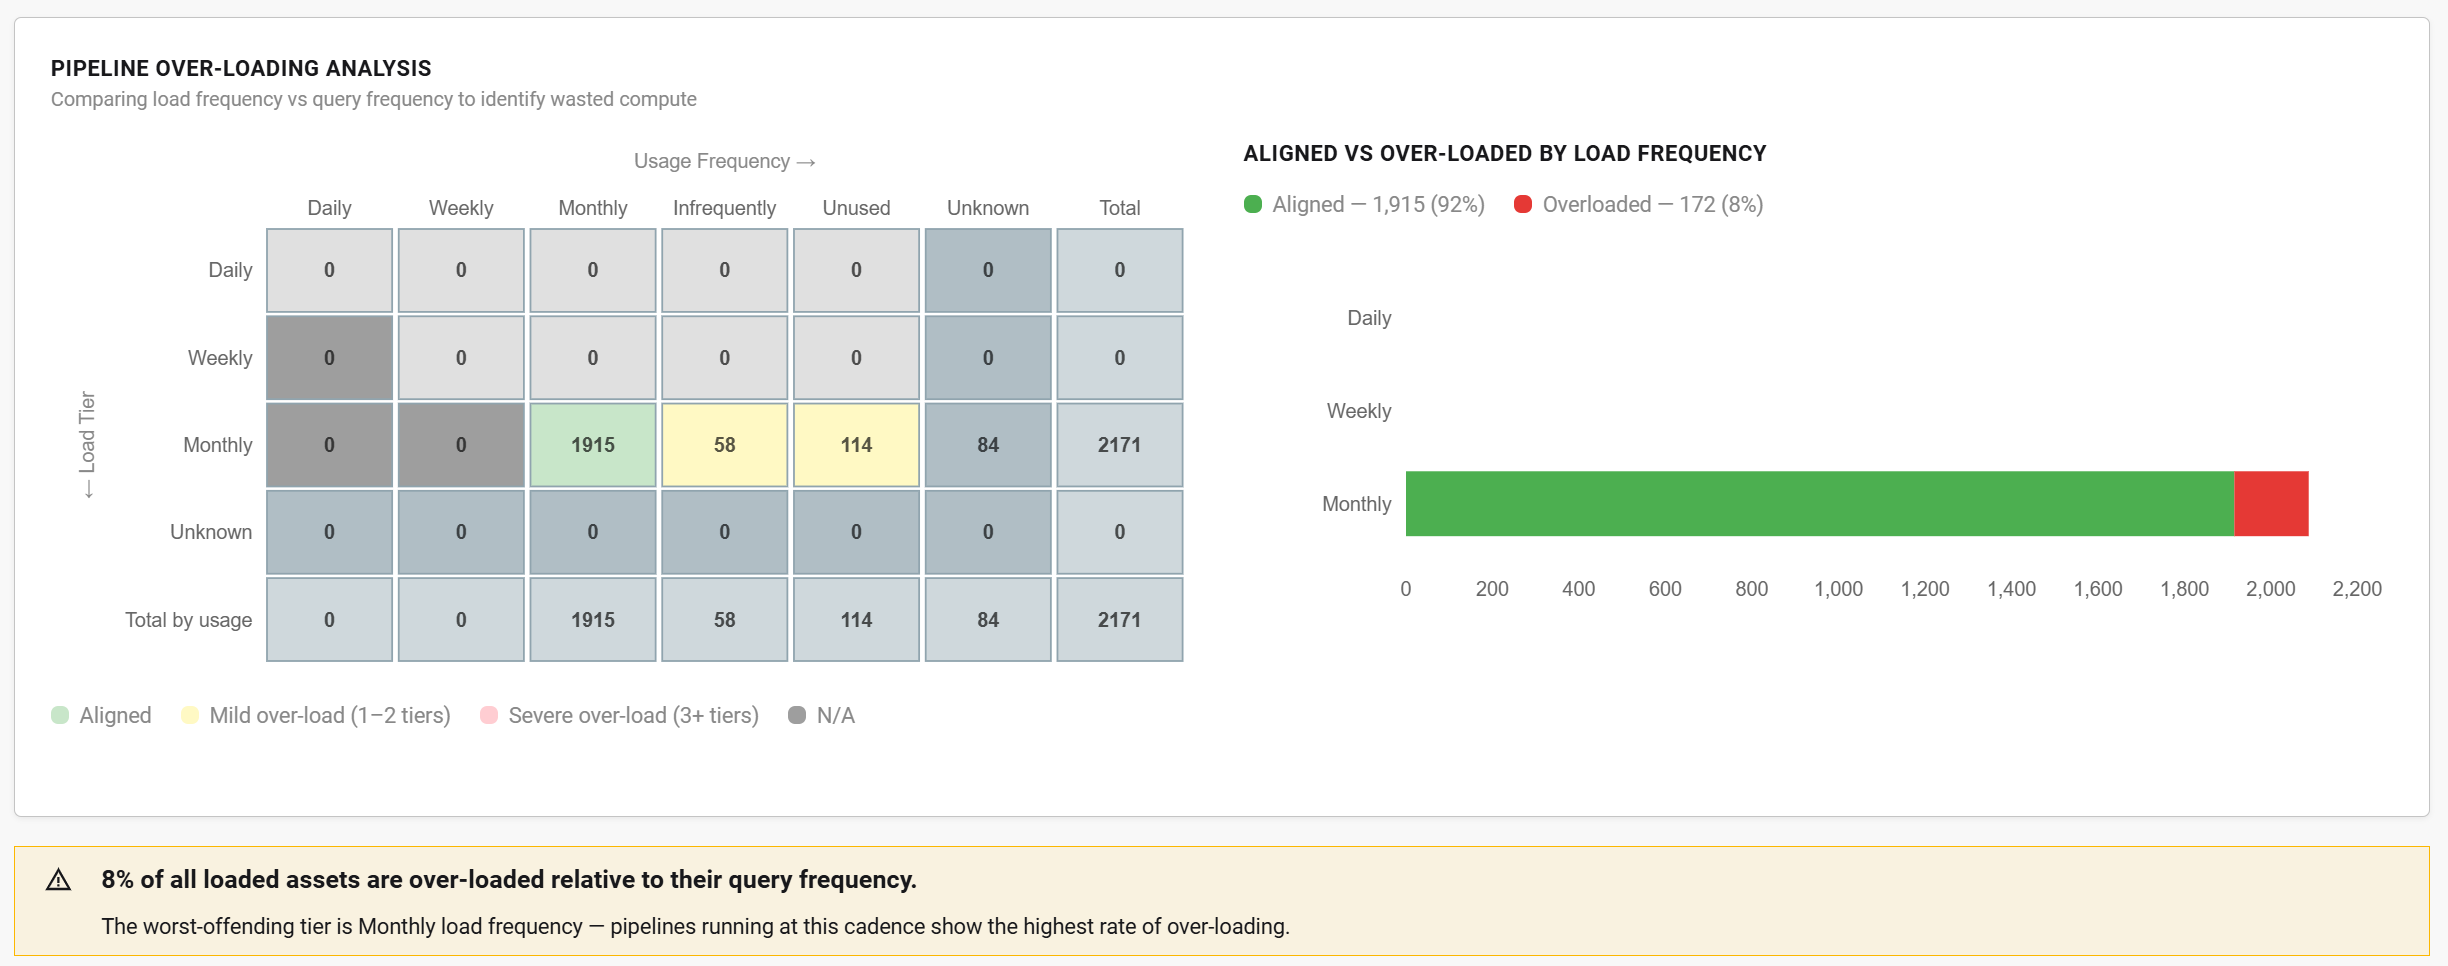
Optimising data load frequency with usage frequency
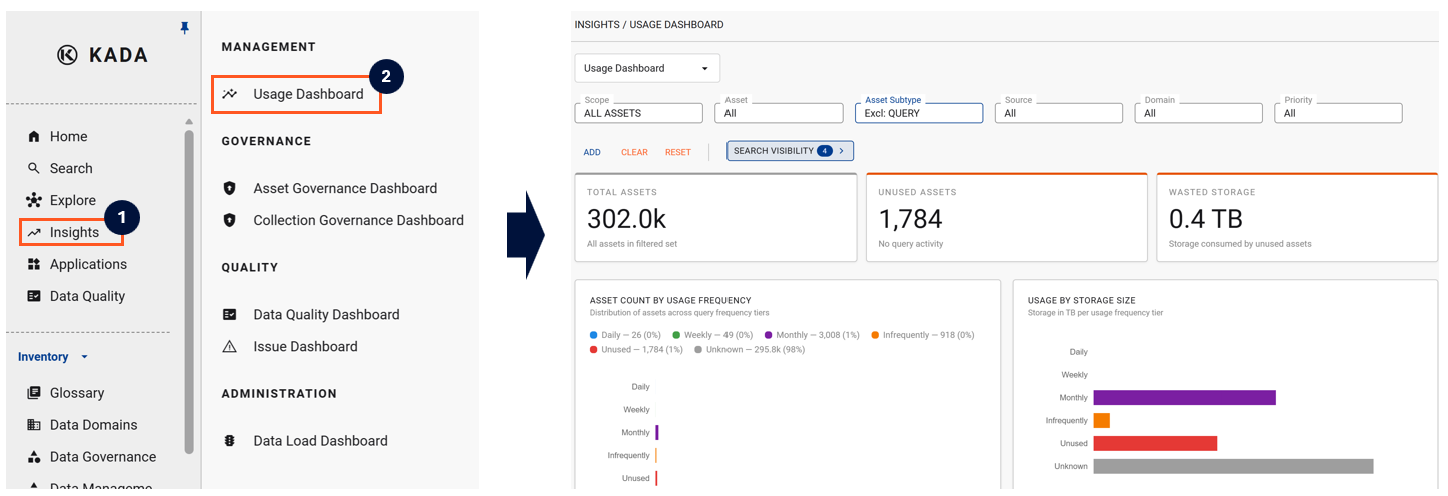
You can drill through on any of the graphs to see the underlying assets through the search view. Using this method, you can also quickly set up regular alerts to help monitor the underlying assets.
Usage Definition
Usage frequency is calculated as follows:
|
Frequency |
Calculation |
|---|---|
|
Daily |
Used in 10+ workdays over the last 3 weeks |
|
Weekly |
Used in 3 different weeks over the last 4 weeks |
|
Monthly |
Used in 3 different months over the last 4 months |
|
Infrequent |
Used at least once within the last 4 months |
|
Unused |
Not used within the last 4 months |
Customising your Dashboard
The top part of your dashboard has a number of filters that you can drill down and refine. Similar to the Search pages, you can choose to add additional filters.
When you change your filter settings, K will remember your last filter settings and retain them. Click reset to change the filters back to the default options
By default, there are a number of standard filters that have been set. These include:
-
Deleted: False (exclude all deleted assets)
-
Reference: False (do not include reference assets)
-
Hidden in K: False (assets that your Data Governance Managers and Admin users have chosen to hide and not have displayed in K by default)
-
Hidden in Source: (assets that are hidden in the Source system)
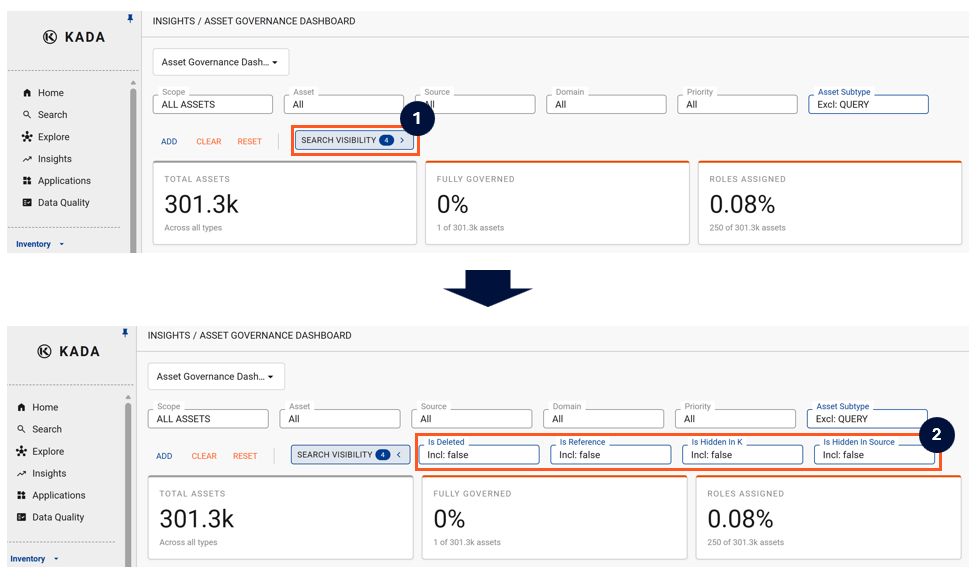
To view and change these default settings, click the Search Visibility button.
Asset Usage Insights
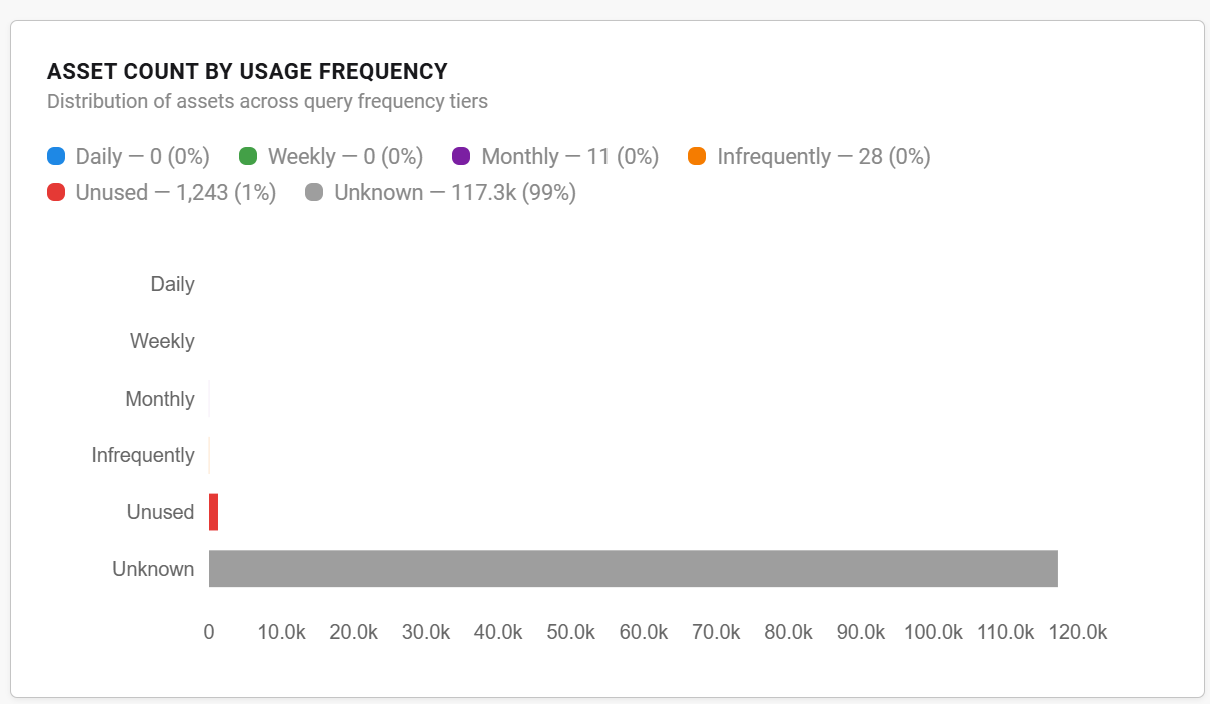
Use the Asset Count graph to quickly identify your most frequently used asset and unused asset.
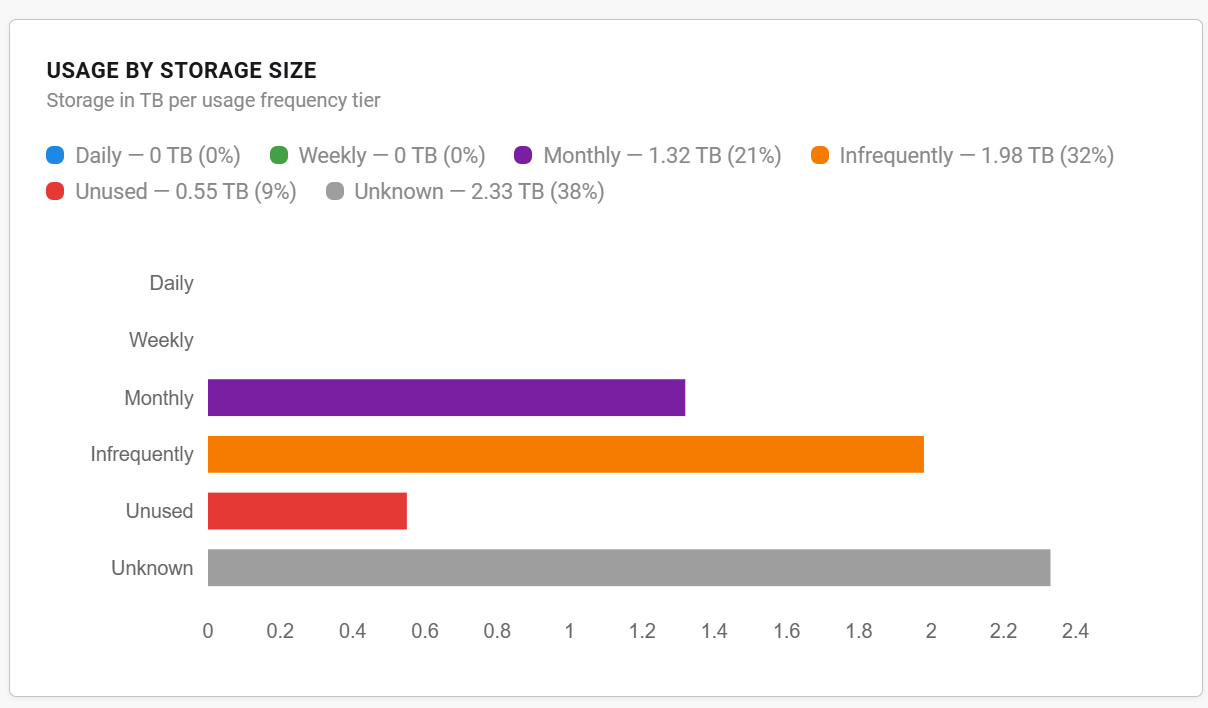
Usage by Storage Insights
This chart help you understand which data assets are taking up the most storage space and the potential storage capacity you could release when targeting assets for decommissioning.
Pipeline Over-loading Insights
Through the dashboard you can quickly compare to check how frequently a data asset is used relative to their loading frequency.
For example, if you have an infrequently used data asset that has a daily load, this may be an opportunity to optimise and reduce the data load for these assets.