The Data Ecosystem Map page provides a visual representation of your data ecosystem — showing how your database sources and content tools are connected, including which sources hold data from a specific domain or belong to a specific classification.
This is particularly useful for showing Architects, Solution Designers, and other users how the systems are connected at a high level.
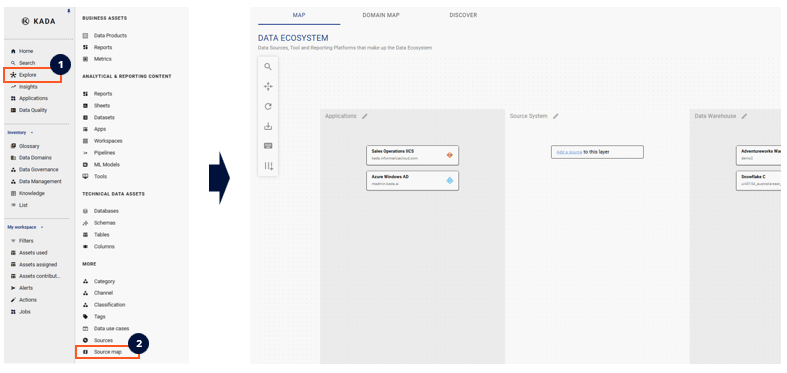
Navigate to the Ecosystem Map by clicking Explore → Source Map in the left-hand navigation.
🔒 All users can view the Ecosystem Map. Only Data Governance Managers, Data Managers, and Admin users can manage Ecosystem Layers.
Understanding Ecosystem Layers
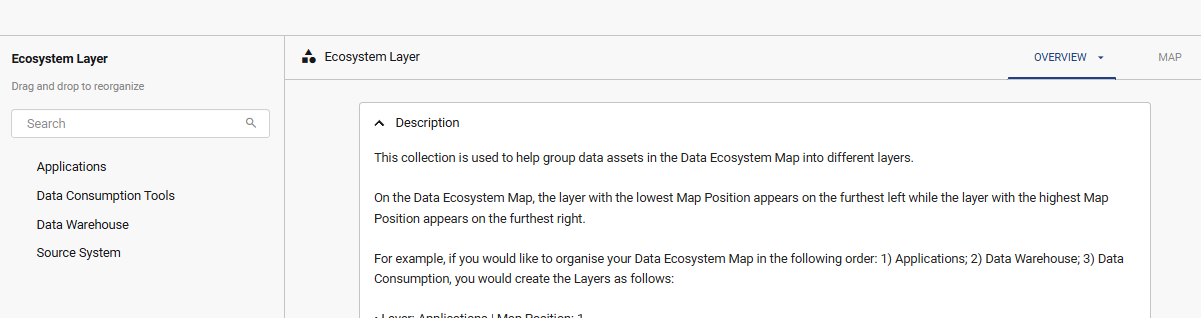
To help you structure your ecosystem map, K uses the Ecosystem Layer concept. Each layer lets you group your data assets into swim-lanes that represent logical tiers in your data architecture (e.g. Sources → Processing → Reporting).
The layer with the lowest Map Position appears on the furthest left; the layer with the highest Map Position appears on the furthest right.
Ecosystem Layers are managed as a Collection — each layer is an instance within that collection. In the below example, the Ecosystem has 4 layers:
-
Applications
-
Data Consumption Tools
-
Data Warehouse
-
Source Systems
💡 Tip: Leave a gap of 10 between each layer's Map Position number when setting up. This lets you insert new layers between existing ones later without needing to re-number everything.
Mapping Sources to Ecosystem Layers
You can easily add sources to the data ecosystem directly in the map.
-
Click the Edit icon on the layer
-
Search for the source and click Add
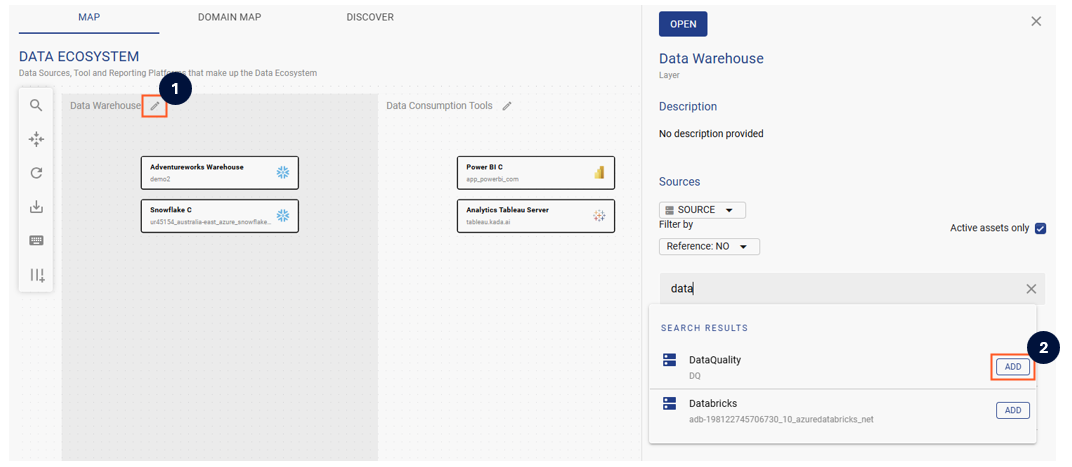
After adding or removing sources there may be a brief delay before the map refreshes. If this occurs, click the Reload Map icon.
Alternatively, you can also open the Ecosystem Layer collection and manually add the instance.