Updated in Version 6.1
K can store track, measure and manage data quality issues across your data ecosystem.
Through the Quality tab, you can quickly view:
-
DQ summary results
-
Issues linked to the data asset
-
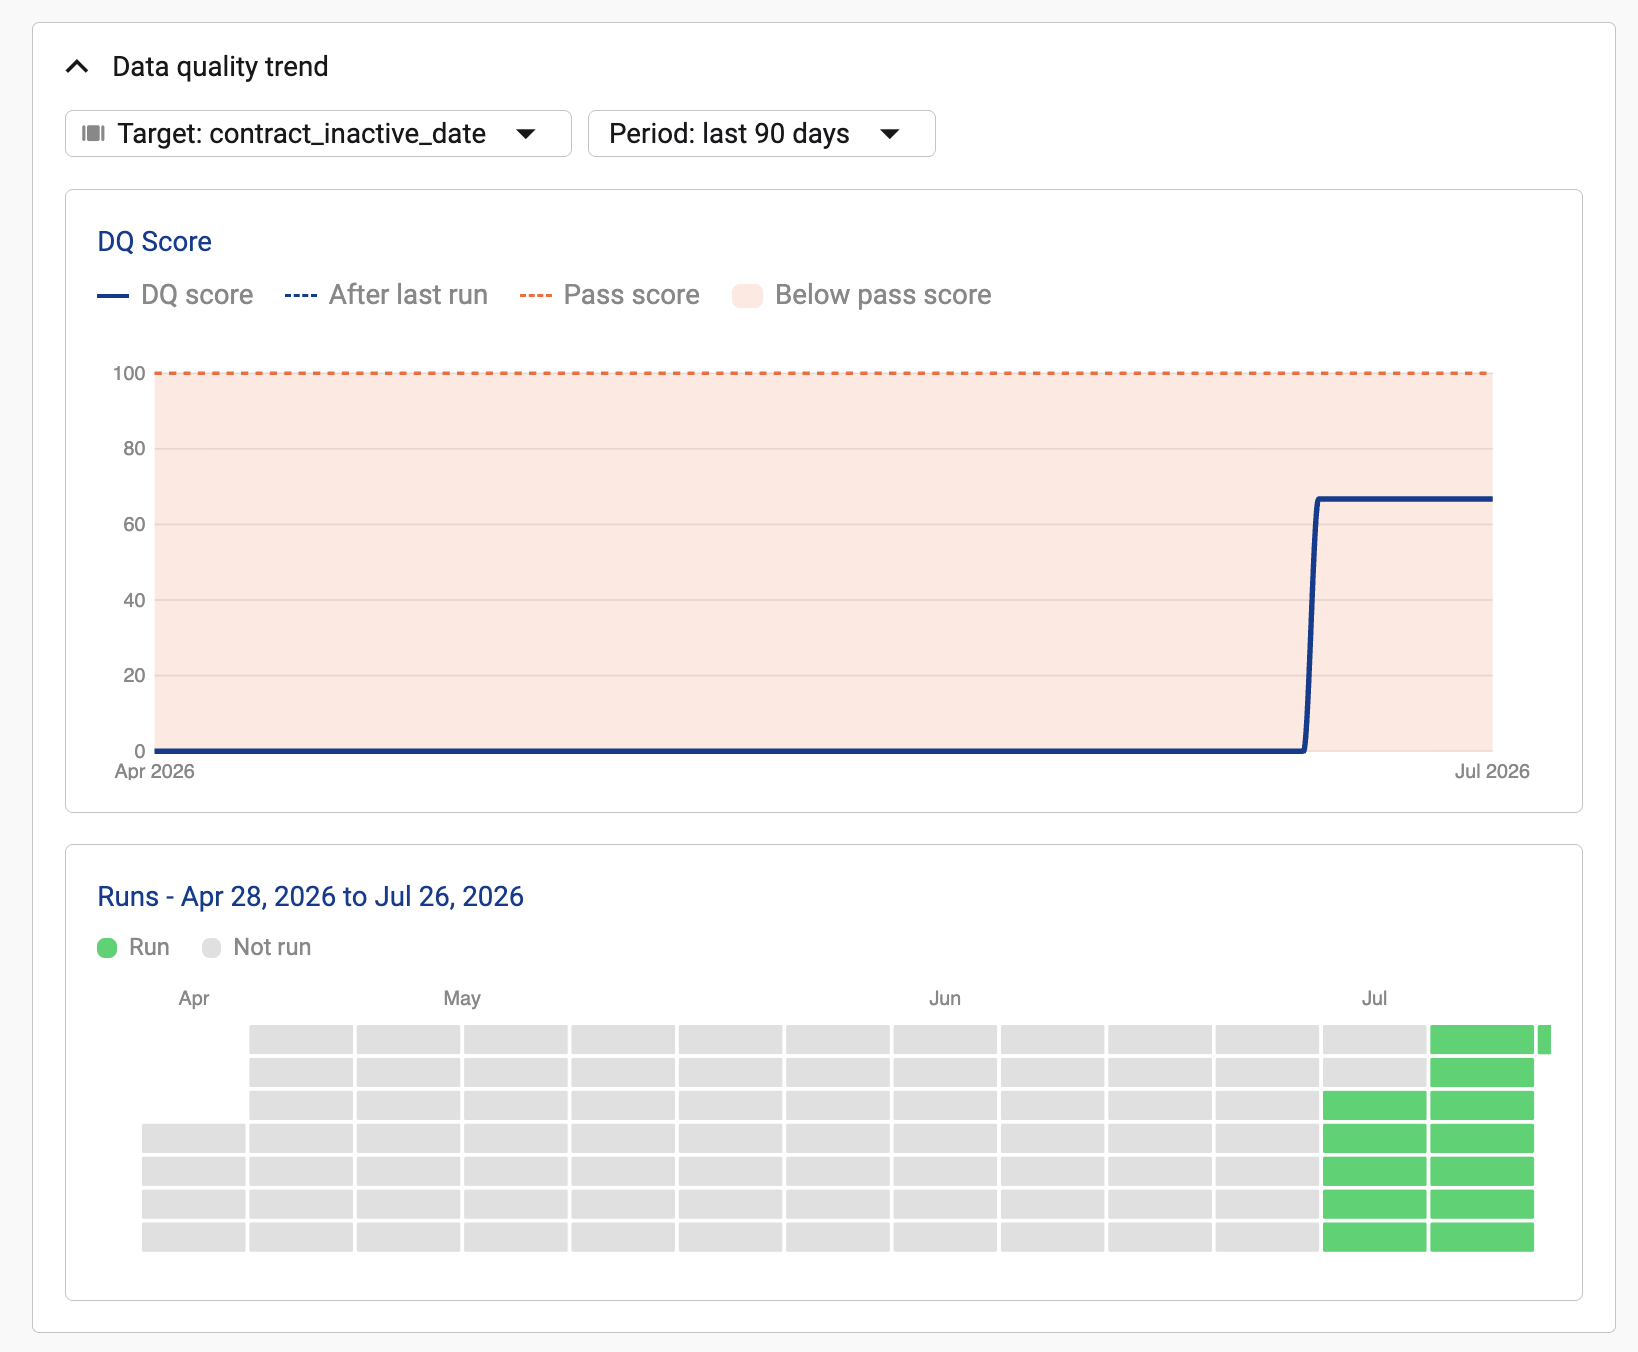
Data quality trend
K can integrate and store Data Quality results from the following Data Quality Applications (DQ Apps):
DQ Summary
If a data quality test has been loaded from a DQ App you will see a Quality tab on the Data Profile Page for the target of the test (e.g. the results of a test run on a column will appear on the column profile page)
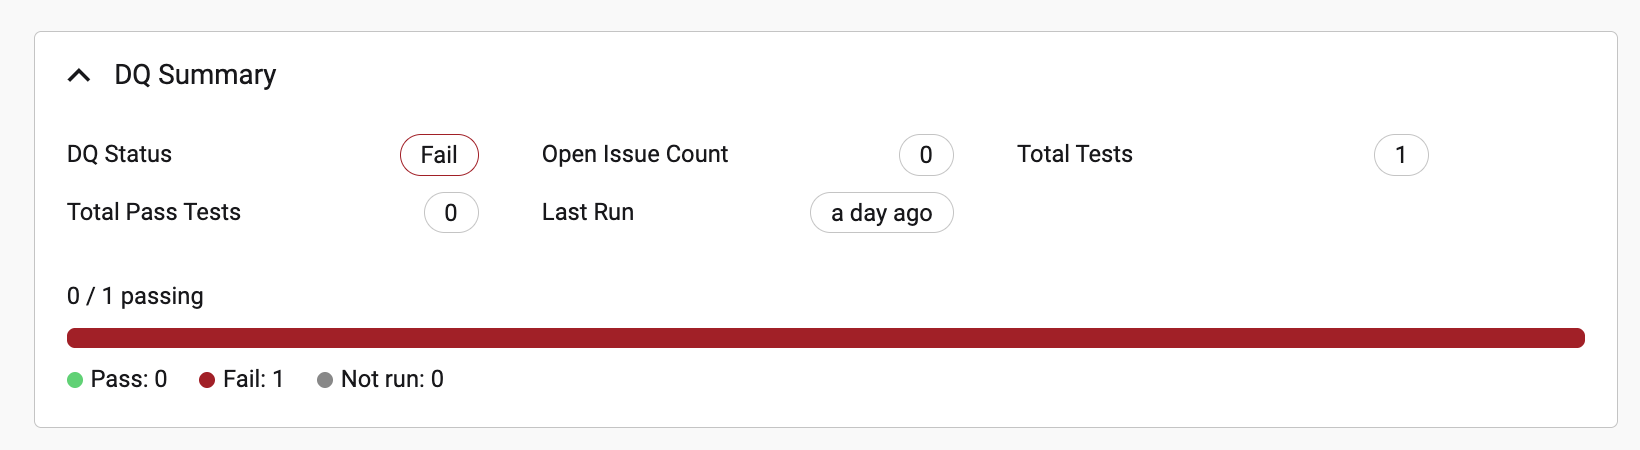
On the Summary section, you can view:
-
DQ Status: Pass or Fail. If any DQ test directly linked to this asset fails, the DQ status is set to fail. Note: If an upstream DQ Test fails, the DQ status is not impacted.
-
Open Issue count: Number of open issues linked to this asset
-
Total Tests: Number of DQ tests directly linked to this asset
-
Total Pass Tests: Total number of DQ test directly linked that are passing
-
When was the last time any DQ test directly linked was run
DQ Tests
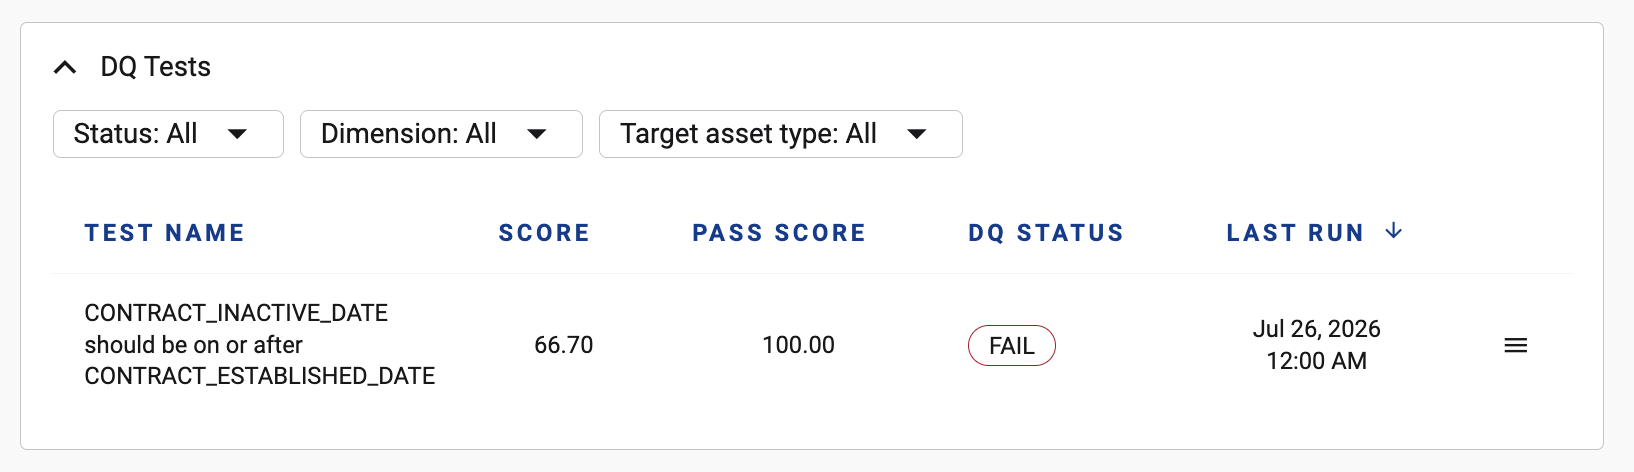
All DQ tests linked to this asset will be displayed in the DQ Tests section.
You can filter
-
Status: To see only Pass or Failed DQ Tests
-
Dimension: Filter to specific DQ tests that apply to a specific Dimension
-
Target asset type: Filter to DQ tests applied to the table or column (for a table asset)
Upstream DQ Tests
All DQ tests linked upstream of this asset will be displayed in the DQ Tests section
Linked Issues
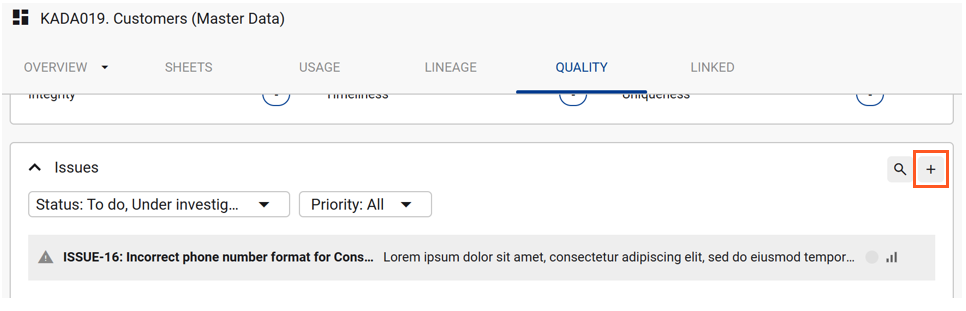
You can easily view all of the linked issues or link a new issue to the data asset by clicking on the add icon
Data Quality Details
To check the data quality trend for a DQ test, click and open a linked DQ Test profile.
Every data quality test tracks the DQ score over time against the threshold set. You can also see when the DQ test runs.