Data migrations from legacy to a new modern stack can be complicated. The first step to figure out what data assets to migrate can be lengthy, manual and error prone.
Using K’s usage analytics capabilities can help you to identify what data to move, what data to archive, and what users and teams are impacted. Using the information from K, you can prioritise the right clusters of data to migrate that can accelerate the migration.
K provides insights, recommendations and reports that can be self serviced at the start and during the migration. At the start of the migration, K automates the migration analysis that would otherwise takes months to complete. During the migration, K provides you with live tracking of your migration to ensure you stay on track.
This page is a primer on how to use some of K’s features to help you understand how your legacy data platform is used.
Understanding usage at the Asset level
You can use K to understand how a specific data asset is used.
Use Search to find the data asset.
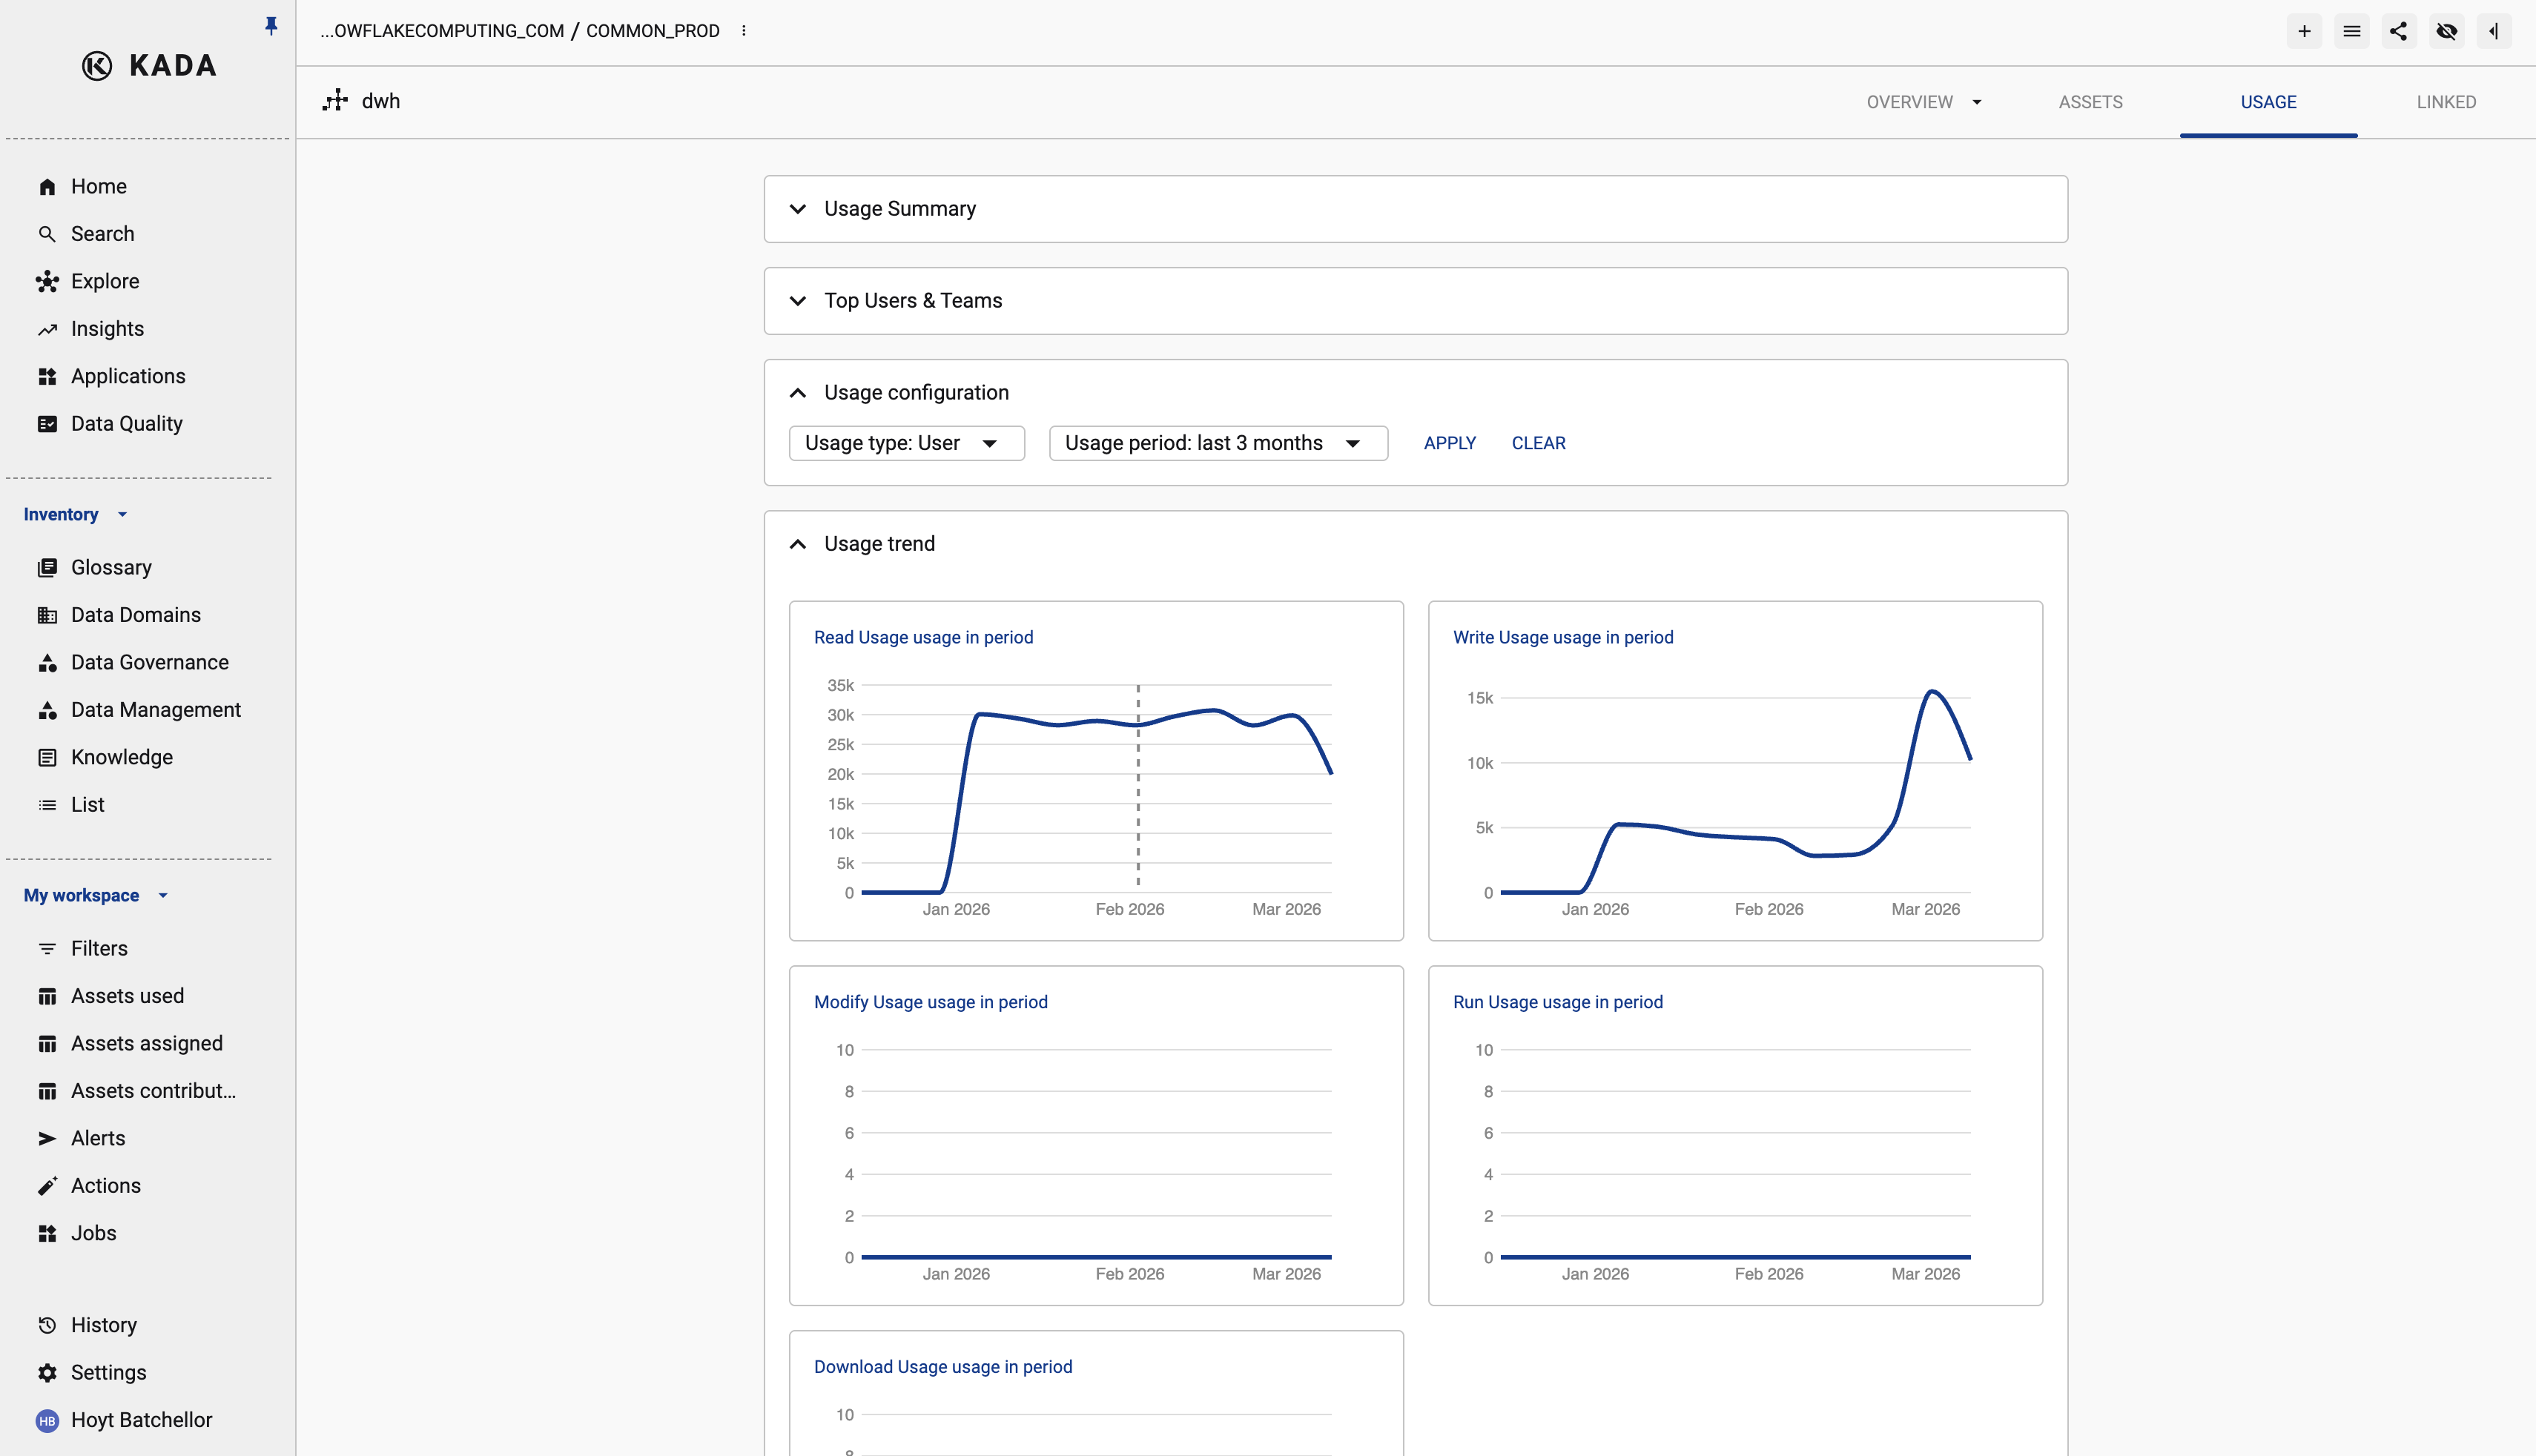
Open the data assets profile and select the Usage tab.
Select the usage period to analyse (e.g. Last 3 months) and click APPLY.
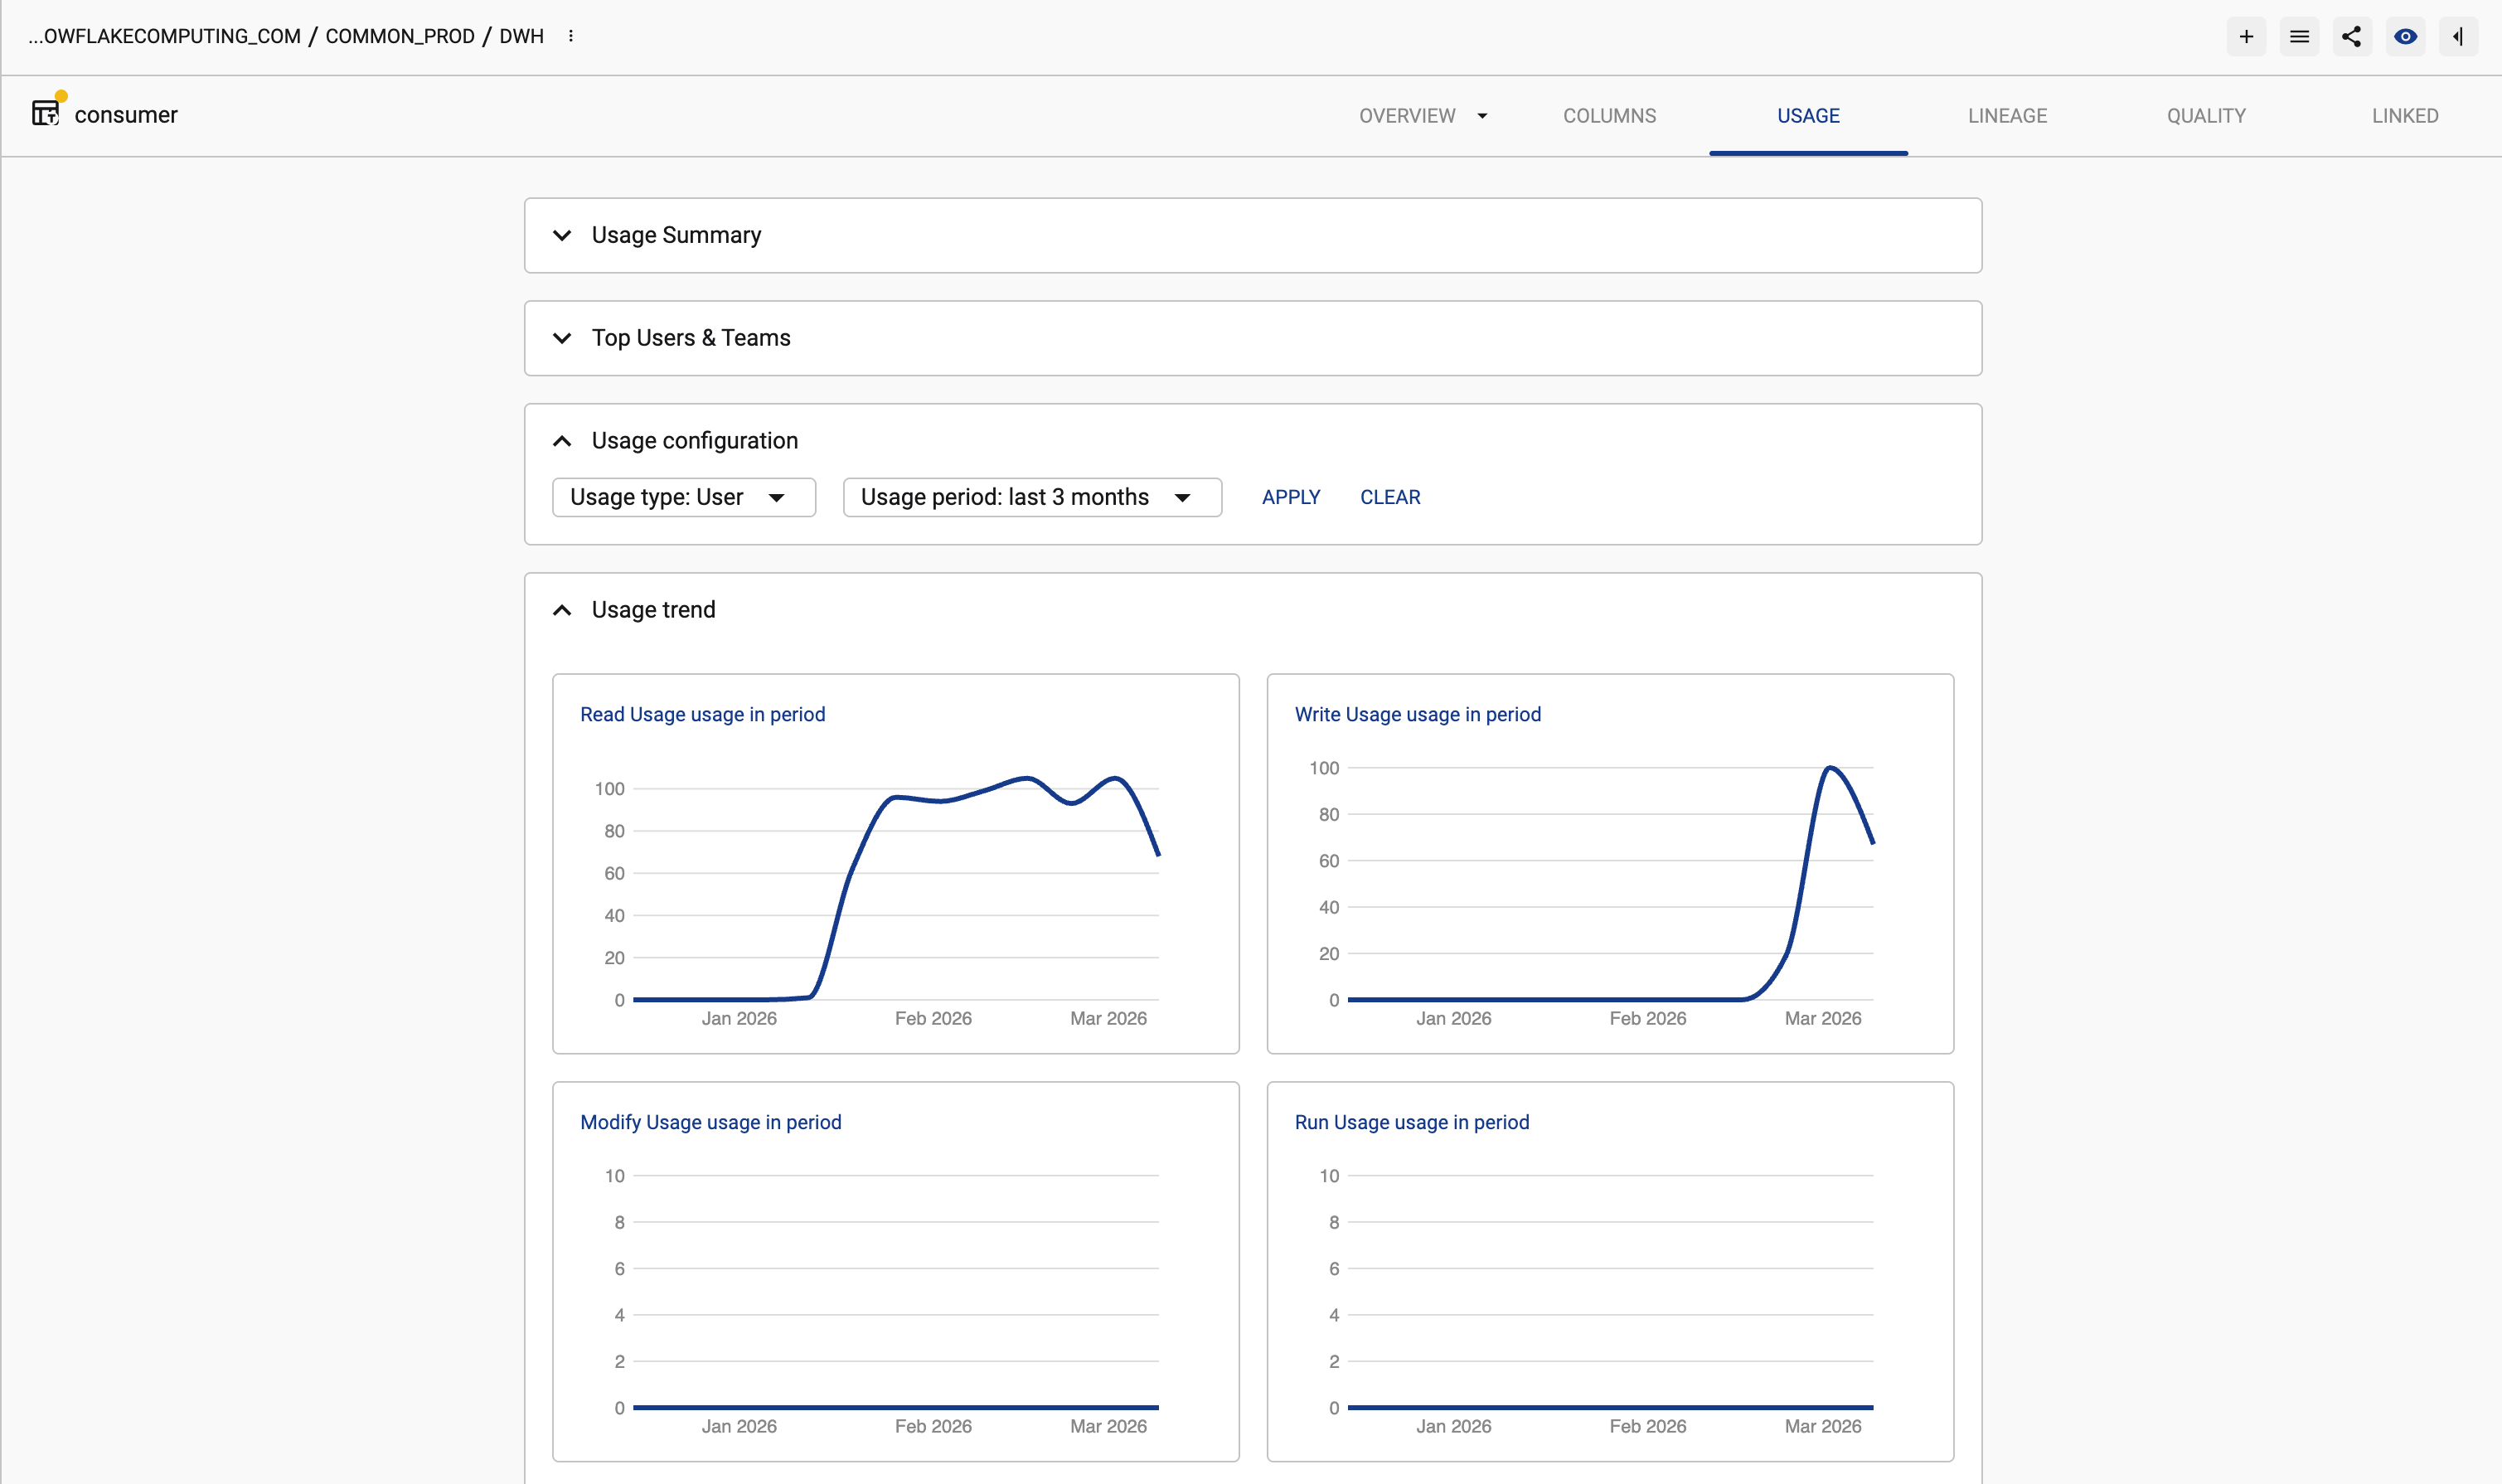
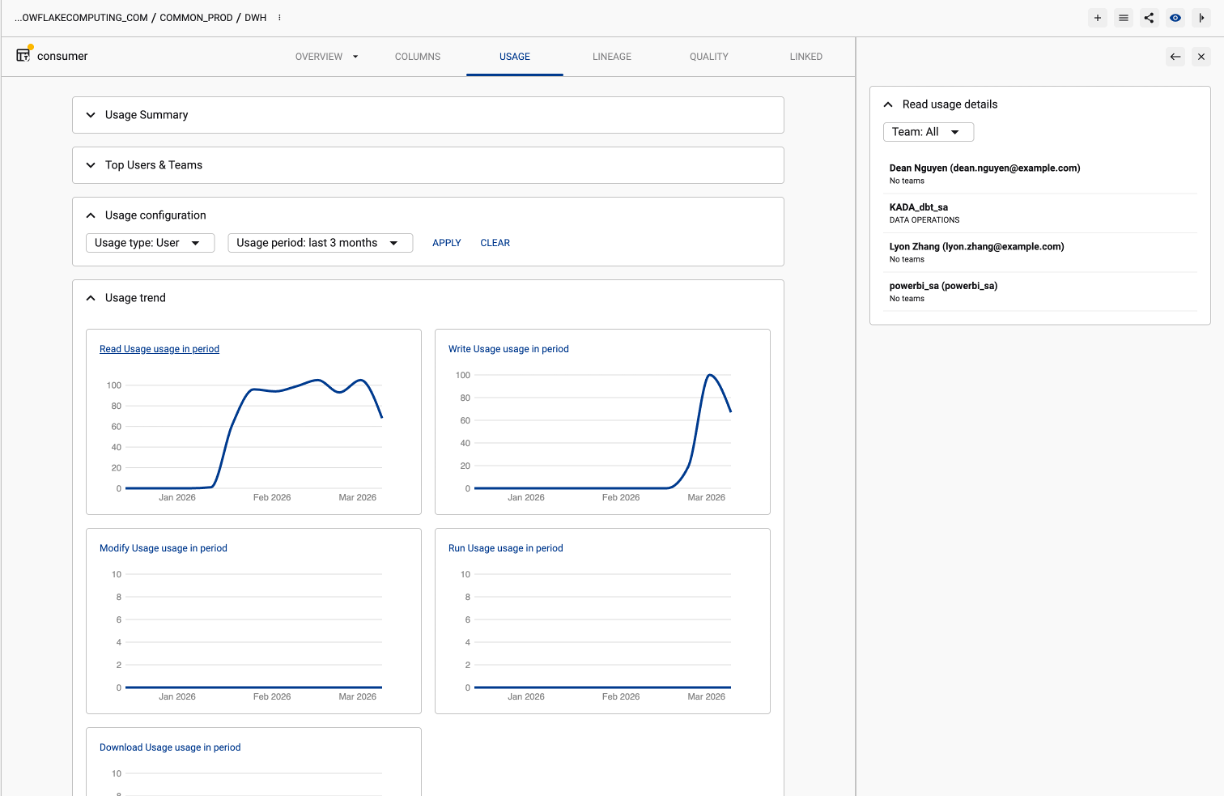
You can select the chart to see the usage for that period of time, or select a day on the chart to who used the asset on that given day.
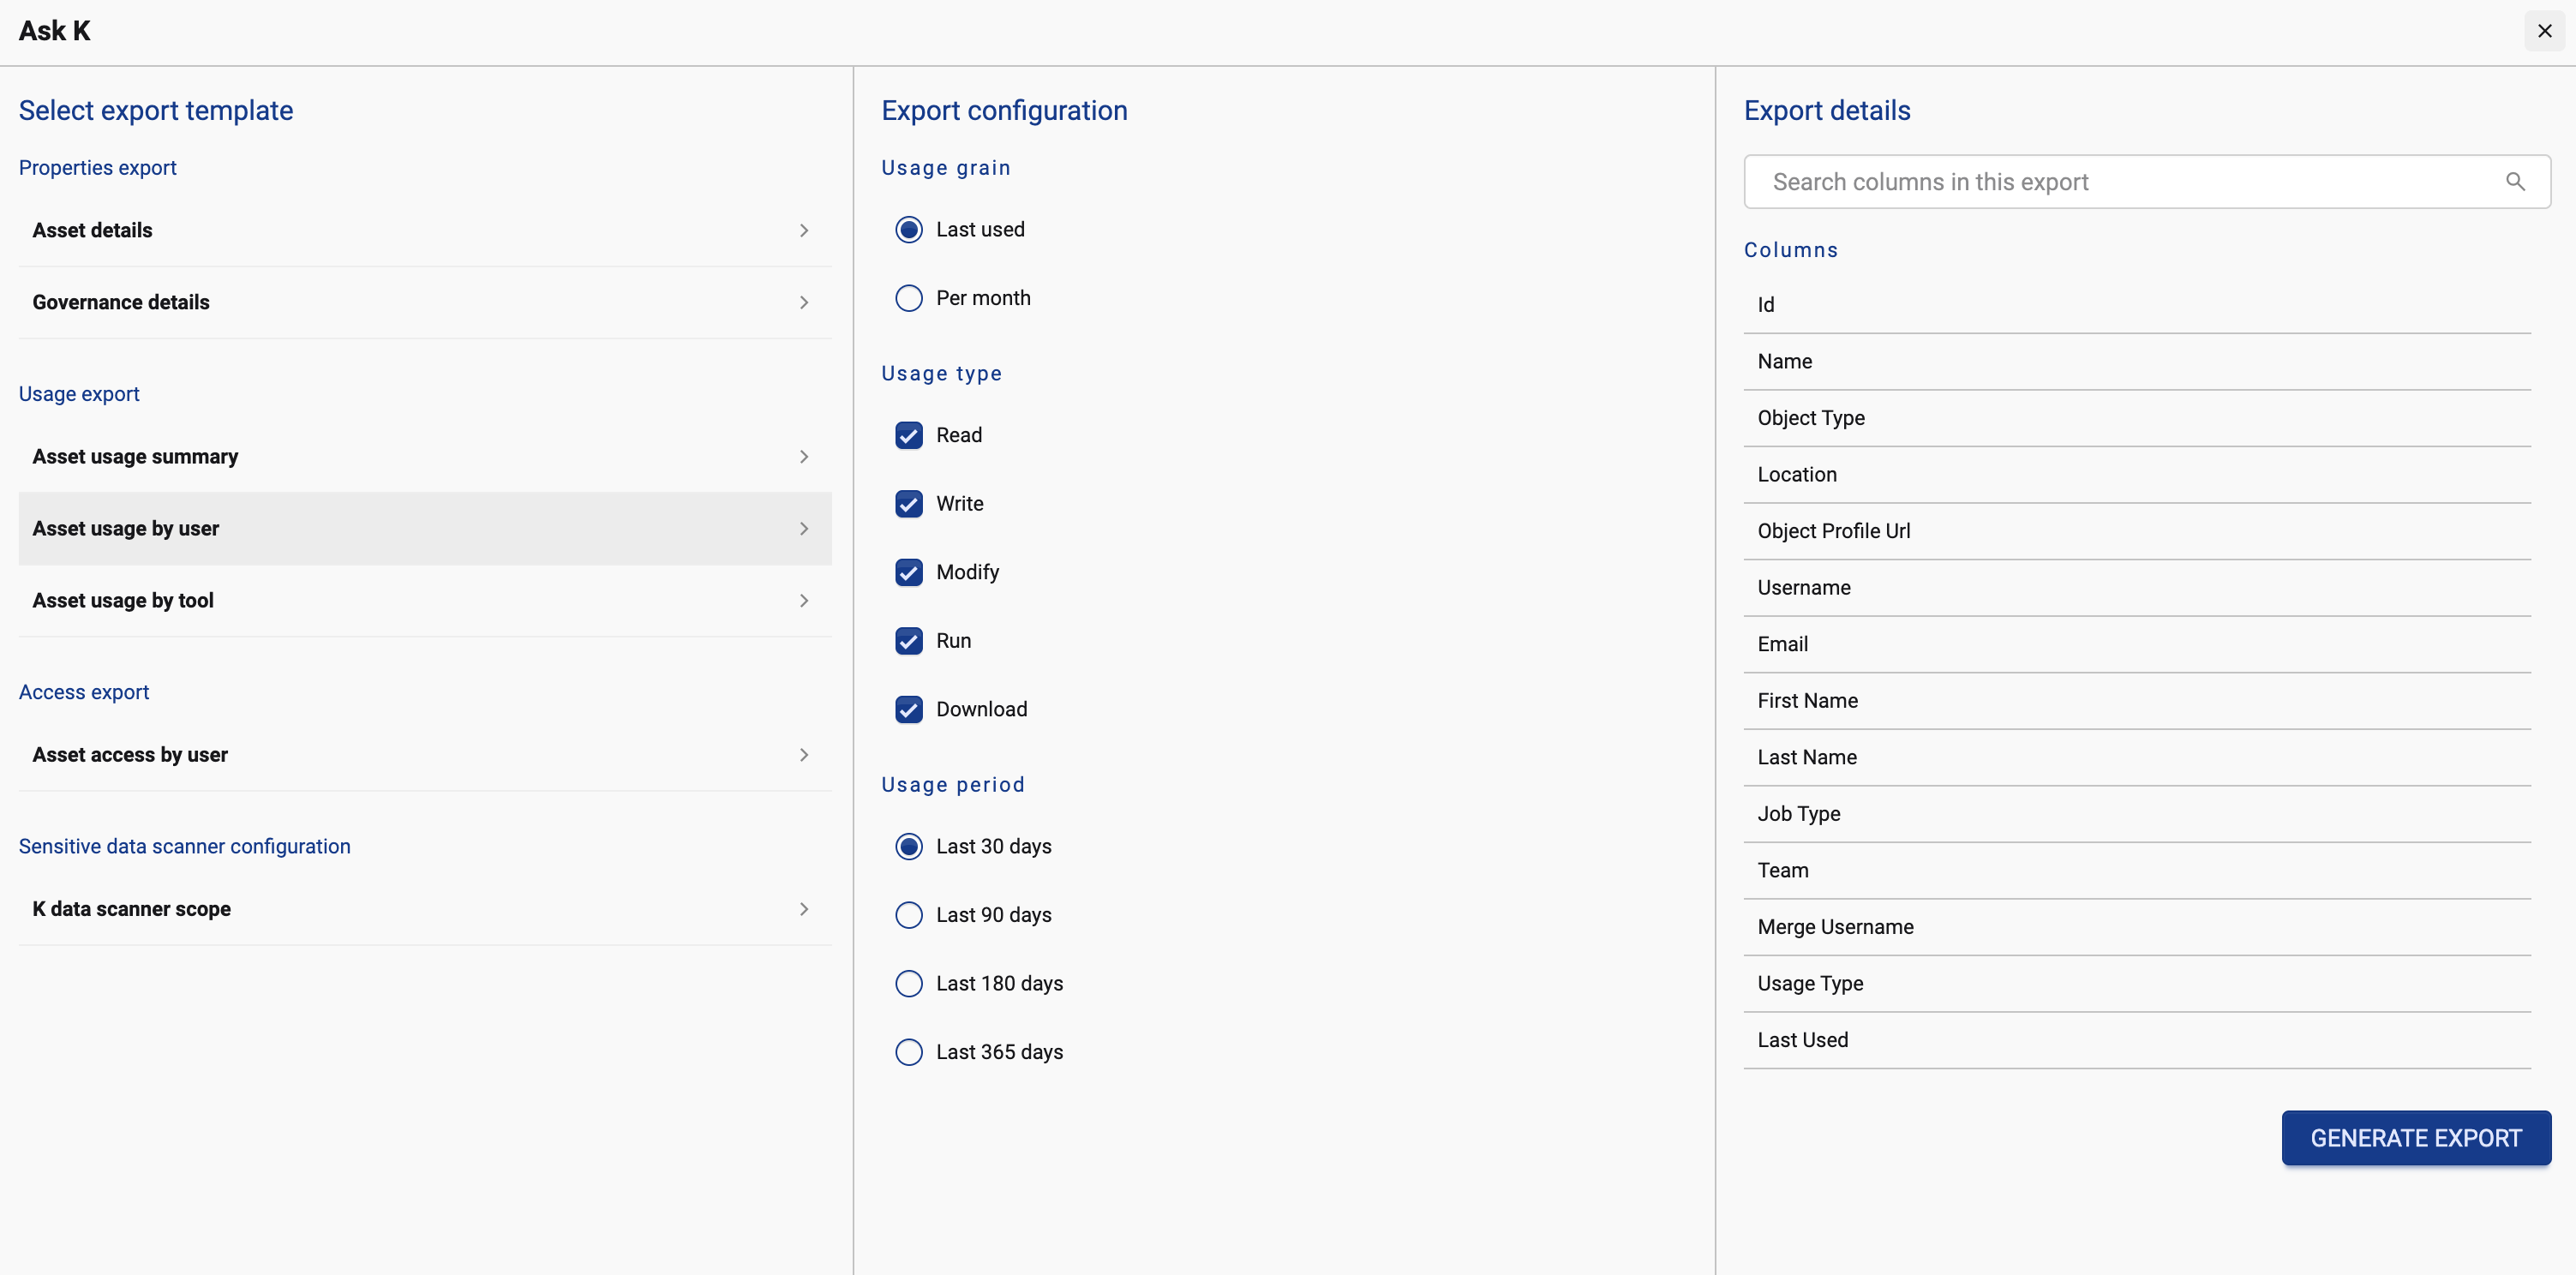
To generate an extract of all usage for this asset, select the menu button and click Generate Exports via Ask K
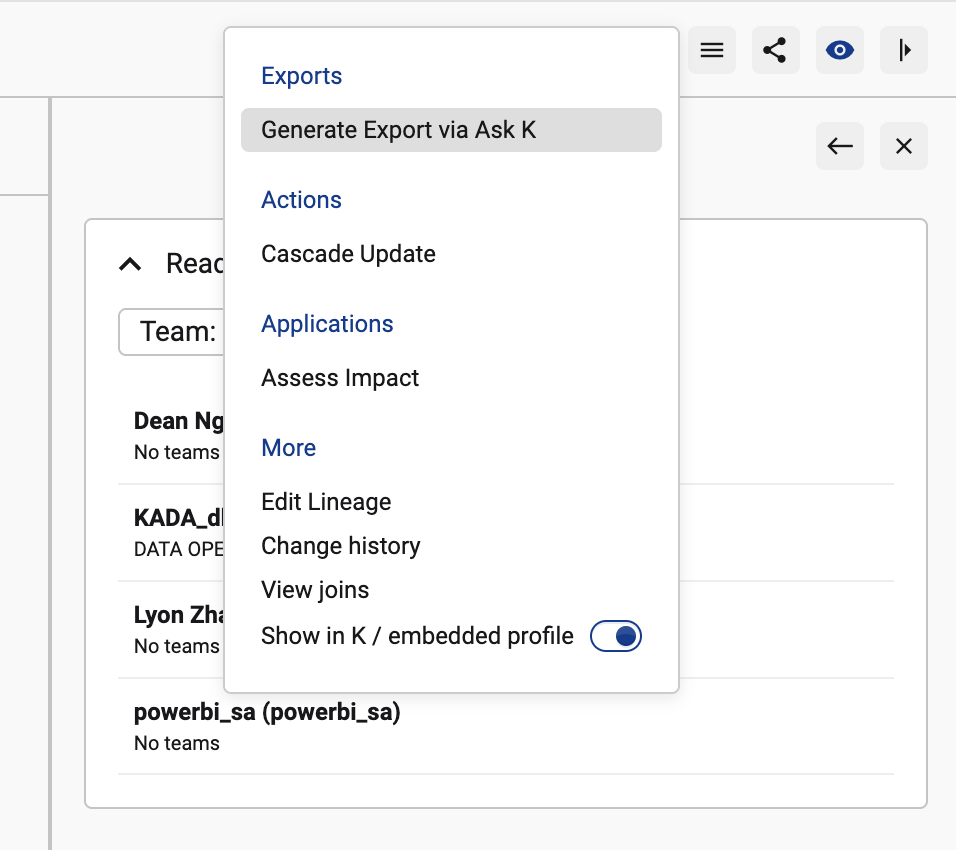
Select the Asset usage by User or Asset usage by tool
Understanding usage at the Schema/Workspace or Database/Tool level
You can use K to understand how groups of data are used. For example, understanding how a Schema of tables is used.
Similar to above, go to the Schema profile page. Select the Usage tab.
Select the usage period to analyse (e.g. Last 3 months) and click APPLY.
Unlike the a single asset, to generate an extract of all usage for a schema, use Search to find all of the tables that belong to the Schema, then run ask K.
To do this easily, from the Schema profile page, go to the Assets tab. Click on the menu button and select View in Search

From the search result you can apply any other filters required. Select Download then Custom export using Ask K
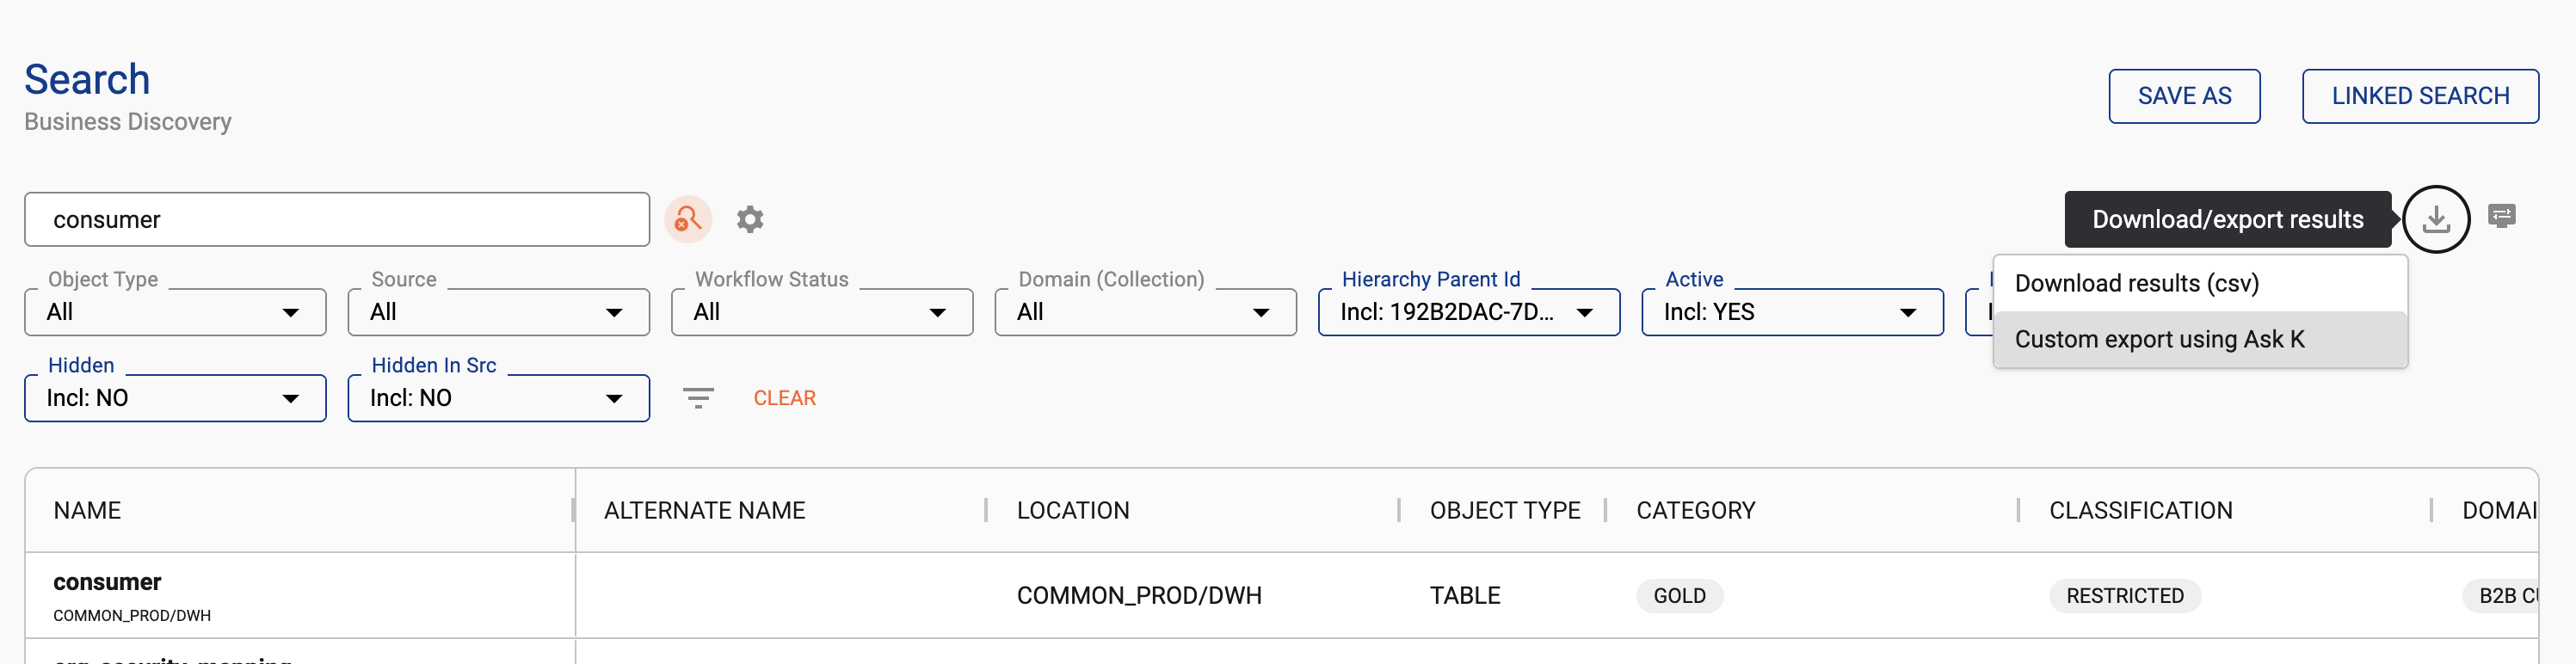
Select the export template appropriate to your use case.
Understanding usage at the Source level
You can use K to understand how an entire source (its tables, schema, and databases) is used.
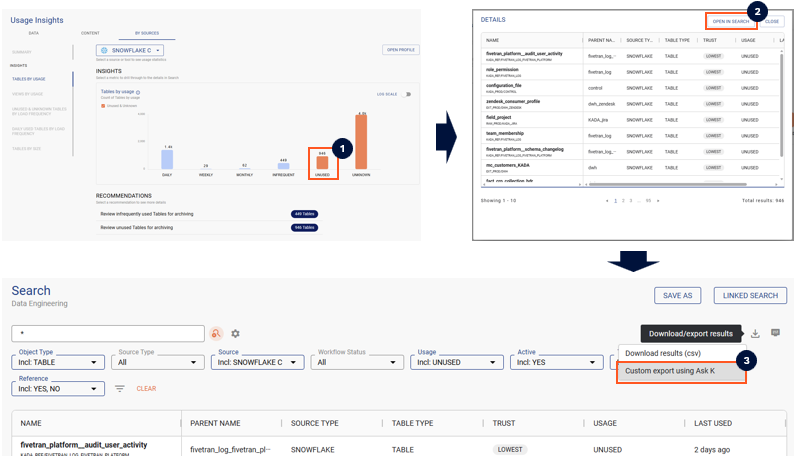
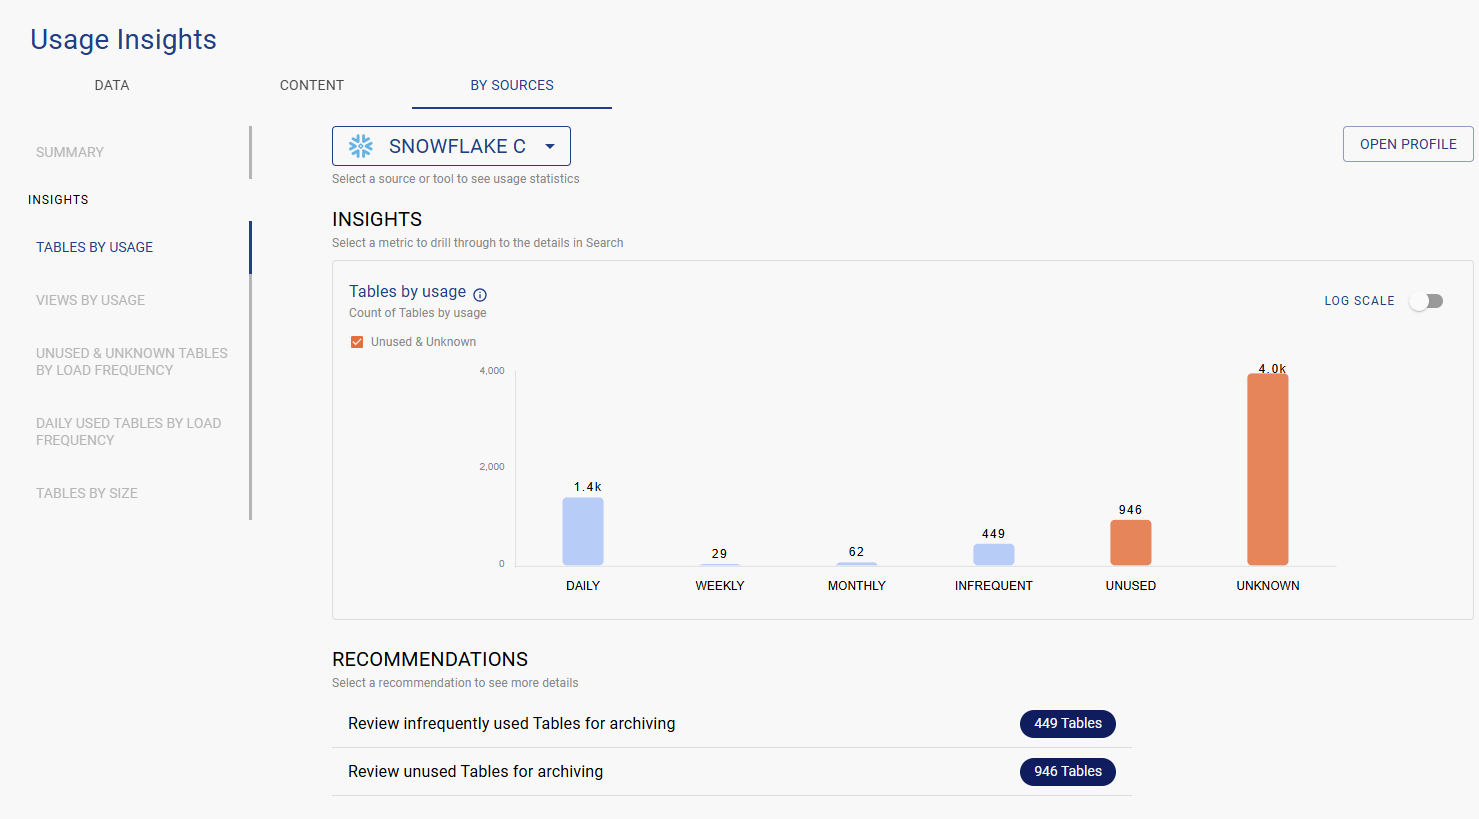
Go to Insights in the menu, and select Usage Insights. Select the By Sources tab and choose the source you want to review.
On this dashboard you can see
-
Breakdown of usage by frequency, by trust score. Select a frequency or trust score to see the data assets that belong to that category.
-
Usage over time
-
Recommendations to review data assets that are unused or used infrequently. These are good opportunities to archive or free up compute and storage prior to the migration
To get granular details about usage at the source level, you can use Ask K to extract details from K.
-
Step 1) Click on the area in the graph you want to drill down into
-
Step 2) The details will appear in a pop up box. Click Open in Search to see all the detailed results
-
Step 3) Click on the download icon and select Custom export using Ask K and select the usage related exports